
Landlord's Agent in 2025
Domenic Keenan
Vincent Keenan, REALTORS
(321) 693-5230
20 in this area
42 Total Sales
Estimated Value: $168,000 - $271,000
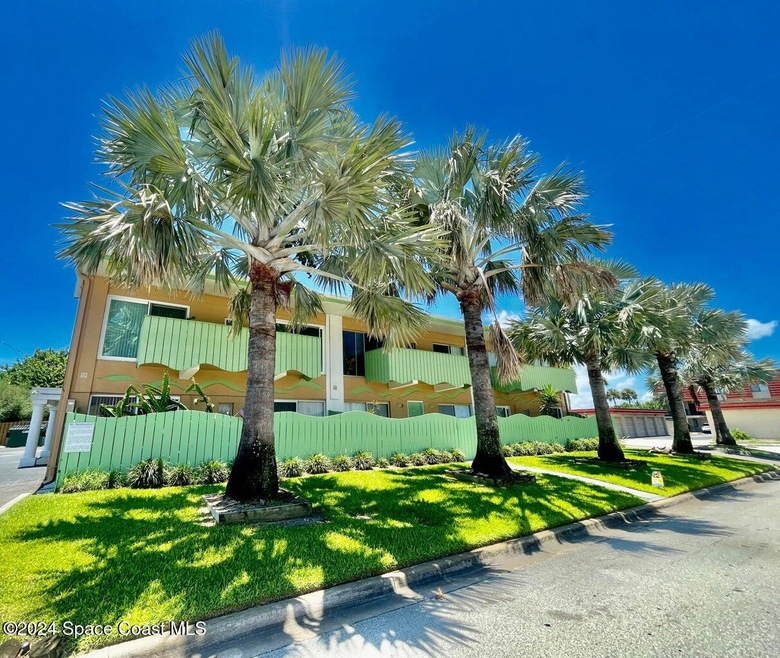
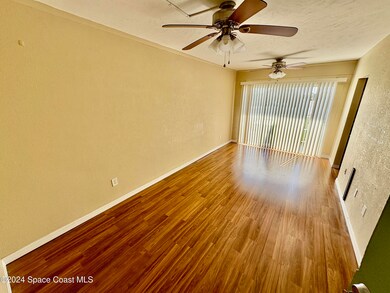
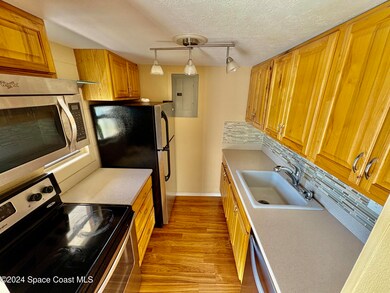
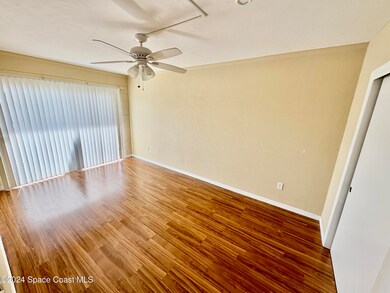
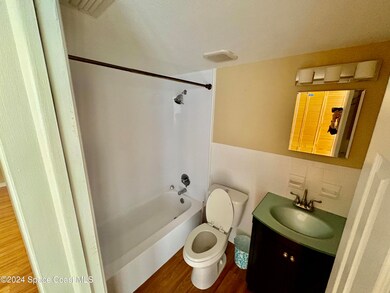
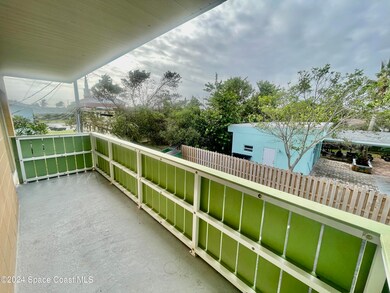
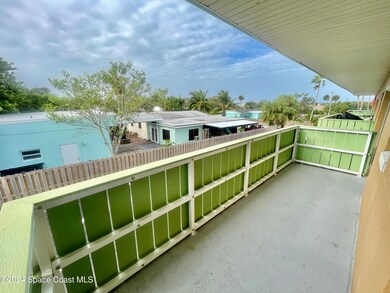
Location, location, location! Large one bedroom on the second floor, only one block from the beach! Private balcony. On site laundry. Beautifully maintained, move in ready. Beachside living at its finest. Enjoy the best of Cocoa Beach in this walk-able neighborhood. XLNT location near all major thoroughfares shopping centers, restaurants, services, Port Canaveral, Kennedy space center, beach line, downtown Cocoa Beach, entertainment, and just steps to the beach.
Last Agent to Rent the Property
Vincent Keenan, REALTORS License #3548316 Listed on: 12/06/2024
| Date | Buyer | Sale Price | Title Company |
|---|---|---|---|
| Ac Properties Of Florida Llc | $200,000 | On Point Title Services | |
| Ac Properties Of Florida Llc | $200,000 | On Point Title Services | |
| Bock David T | $100,000 | The Title Co Of Brevard Inc | |
| Hopkins Margaret L | $60,000 | Atgf | |
| Federal National Mortgage Association | -- | None Available | |
| Friday Emory | $63,000 | Gulfatlantic Title |
| Date | Status | Borrower | Loan Amount |
|---|---|---|---|
| Previous Owner | Bock David T | $90,000 | |
| Previous Owner | Friday Emory | $58,000 |
| Date | Event | Price | List to Sale | Price per Sq Ft | Prior Sale |
|---|---|---|---|---|---|
| 01/10/2025 01/10/25 | Rented | $1,350 | 0.0% | -- | |
| 12/06/2024 12/06/24 | Under Contract | -- | -- | -- | |
| 12/06/2024 12/06/24 | For Rent | $1,350 | 0.0% | -- | |
| 12/05/2024 12/05/24 | Off Market | $1,350 | -- | -- | |
| 12/05/2024 12/05/24 | For Rent | $1,350 | +25.6% | -- | |
| 11/18/2024 11/18/24 | Off Market | $1,075 | -- | -- | |
| 08/28/2023 08/28/23 | Sold | $200,000 | 0.0% | $281 / Sq Ft | View Prior Sale |
| 08/23/2023 08/23/23 | Sold | $200,000 | -4.8% | $281 / Sq Ft | View Prior Sale |
| 07/28/2023 07/28/23 | Pending | -- | -- | -- | |
| 07/22/2023 07/22/23 | Pending | -- | -- | -- | |
| 06/02/2023 06/02/23 | For Sale | $210,000 | 0.0% | $295 / Sq Ft | |
| 05/25/2023 05/25/23 | Price Changed | $210,000 | -4.5% | $295 / Sq Ft | |
| 04/14/2023 04/14/23 | Price Changed | $220,000 | -4.3% | $309 / Sq Ft | |
| 03/03/2023 03/03/23 | For Sale | $230,000 | 0.0% | $323 / Sq Ft | |
| 02/25/2023 02/25/23 | Pending | -- | -- | -- | |
| 02/23/2023 02/23/23 | For Sale | $230,000 | 0.0% | $323 / Sq Ft | |
| 12/01/2022 12/01/22 | Rented | $1,300 | 0.0% | -- | |
| 11/28/2022 11/28/22 | Under Contract | -- | -- | -- | |
| 11/22/2022 11/22/22 | For Rent | $1,300 | +13.0% | -- | |
| 10/31/2020 10/31/20 | Rented | $1,150 | 0.0% | -- | |
| 10/27/2020 10/27/20 | Under Contract | -- | -- | -- | |
| 10/23/2020 10/23/20 | For Rent | $1,150 | +7.0% | -- | |
| 10/01/2018 10/01/18 | Rented | $1,075 | 0.0% | -- | |
| 09/25/2018 09/25/18 | Under Contract | -- | -- | -- | |
| 08/30/2018 08/30/18 | For Rent | $1,075 | +4.9% | -- | |
| 12/01/2017 12/01/17 | Rented | $1,025 | 0.0% | -- | |
| 11/10/2017 11/10/17 | For Rent | $1,025 | 0.0% | -- | |
| 06/30/2017 06/30/17 | Rented | $1,025 | +2.5% | -- | |
| 05/16/2017 05/16/17 | For Rent | $1,000 | -7.0% | -- | |
| 01/19/2017 01/19/17 | Rented | $1,075 | +7.5% | -- | |
| 01/18/2017 01/18/17 | Under Contract | -- | -- | -- | |
| 01/16/2017 01/16/17 | For Rent | $1,000 | -7.0% | -- | |
| 06/15/2016 06/15/16 | Rented | $1,075 | +7.5% | -- | |
| 06/12/2016 06/12/16 | Under Contract | -- | -- | -- | |
| 05/10/2016 05/10/16 | For Rent | $1,000 | -7.0% | -- | |
| 10/11/2015 10/11/15 | Rented | $1,075 | +7.5% | -- | |
| 10/09/2015 10/09/15 | Under Contract | -- | -- | -- | |
| 10/06/2015 10/06/15 | For Rent | $1,000 | 0.0% | -- | |
| 09/14/2015 09/14/15 | Sold | $100,000 | +1.0% | $140 / Sq Ft | View Prior Sale |
| 07/23/2015 07/23/15 | Pending | -- | -- | -- | |
| 02/06/2015 02/06/15 | For Sale | $99,000 | +65.0% | $139 / Sq Ft | |
| 04/14/2014 04/14/14 | Sold | $60,000 | -33.3% | $84 / Sq Ft | View Prior Sale |
| 03/04/2014 03/04/14 | Pending | -- | -- | -- | |
| 11/06/2013 11/06/13 | For Sale | $89,900 | -- | $126 / Sq Ft |
| Year | Tax Paid | Tax Assessment Tax Assessment Total Assessment is a certain percentage of the fair market value that is determined by local assessors to be the total taxable value of land and additions on the property. | Land | Improvement |
|---|---|---|---|---|
| 2025 | $2,566 | $169,930 | -- | -- |
| 2024 | $2,077 | $155,870 | -- | -- |
| 2023 | $2,077 | $123,910 | $0 | $123,910 |
| 2022 | $1,977 | $133,240 | $0 | $0 |
| 2021 | $1,771 | $106,000 | $0 | $106,000 |
| 2020 | $1,699 | $106,000 | $0 | $106,000 |
| 2019 | $1,534 | $88,910 | $0 | $88,910 |
| 2018 | $1,516 | $86,300 | $0 | $86,300 |
| 2017 | $1,517 | $83,720 | $0 | $83,720 |
| 2016 | $1,547 | $83,720 | $0 | $0 |
| 2015 | $1,496 | $80,500 | $0 | $0 |
| 2014 | $1,113 | $58,460 | $0 | $0 |
Landlord's Agent in 2025
Domenic Keenan
Vincent Keenan, REALTORS
(321) 693-5230
20 in this area
42 Total Sales
Seller's Agent in 2023
Salvatore Burke
BURKE GROUP REAL ESTATE
(321) 794-4966
2 in this area
41 Total Sales
S
Buyer's Agent in 2023
Stellar Non-Member Agent
FL_MFRMLS
Buyer's Agent in 2023
Rick Wiedenhoeft
Keller Williams Realty Brevard
(321) 614-9461
2 in this area
52 Total Sales
Seller's Agent in 2022
Justin Brown
RE/MAX
(321) 752-5858
1 in this area
64 Total Sales
B
Buyer's Agent in 2022
Brooke Brown
Epique Realty Inc.
(321) 358-7376
3 Total Sales
Source: Space Coast MLS (Space Coast Association of REALTORS®)
MLS Number: 1031294
APN: 25-37-15-00-00781.L-0000.00
Disclaimer: Certain information contained herein is derived from information provided by parties other than Homes.com. All information provided is deemed reliable, but is not guaranteed to be accurate and should be independently verified.
![]() IDX information is provided exclusively for personal, non-commercial use, and may not be used for any purpose other than to identify prospective properties consumers may be interested in purchasing.
IDX information is provided exclusively for personal, non-commercial use, and may not be used for any purpose other than to identify prospective properties consumers may be interested in purchasing.
Information is deemed reliable but not guaranteed.