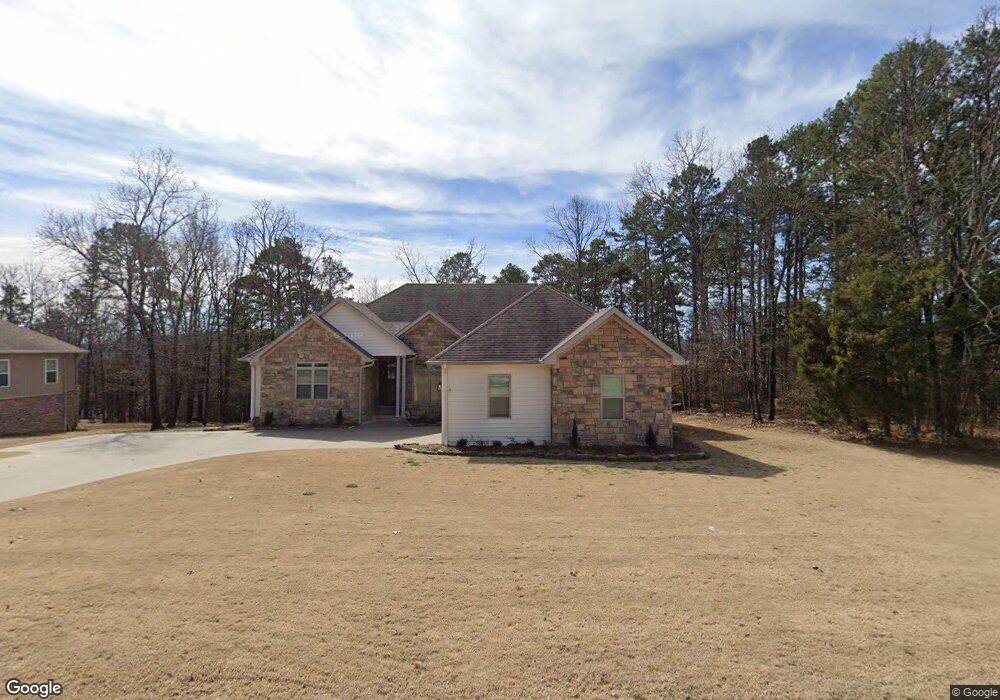
801 Summer Heights Dr Heber Springs, AR 72543
Estimated Value: $577,000 - $796,000
--
Bed
1
Bath
3,528
Sq Ft
$183/Sq Ft
Est. Value
About This Home
This home is located at 801 Summer Heights Dr, Heber Springs, AR 72543 and is currently estimated at $647,345, approximately $183 per square foot. 801 Summer Heights Dr is a home with nearby schools including Heber Springs Elementary School, Heber Springs Middle School, and Heber Springs High School.
Ownership History
Date
Name
Owned For
Owner Type
Purchase Details
Closed on
Apr 25, 2024
Sold by
Stone Casey and Stone Revocable Living Trust
Bought by
Gowen Darren T and Gowen Lesli C
Current Estimated Value
Home Financials for this Owner
Home Financials are based on the most recent Mortgage that was taken out on this home.
Original Mortgage
$180,000
Outstanding Balance
$177,471
Interest Rate
6.87%
Mortgage Type
New Conventional
Estimated Equity
$469,874
Purchase Details
Closed on
May 24, 2010
Sold by
Stone Willie Dee and Stone Evangeline Ann
Bought by
Stone Casey B and Stone Felicia
Purchase Details
Closed on
Sep 30, 2008
Sold by
Reynolds Jimmy and Reynolds Verna
Bought by
Stone Willie Dee and Stone Evangeline Ann
Purchase Details
Closed on
May 15, 2000
Bought by
Clebco Development, Inc
Purchase Details
Closed on
Feb 10, 2000
Bought by
Reylance, Inc
Create a Home Valuation Report for This Property
The Home Valuation Report is an in-depth analysis detailing your home's value as well as a comparison with similar homes in the area
Home Values in the Area
Average Home Value in this Area
Purchase History
| Date | Buyer | Sale Price | Title Company |
|---|---|---|---|
| Gowen Darren T | $570,000 | Land Title | |
| Stone Casey B | -- | -- | |
| Stone Willie Dee | $26,500 | None Available | |
| Clebco Development, Inc | -- | -- | |
| Clebco Development, Inc | $900,000 | -- | |
| Reylance, Inc | -- | -- |
Source: Public Records
Mortgage History
| Date | Status | Borrower | Loan Amount |
|---|---|---|---|
| Open | Gowen Darren T | $180,000 |
Source: Public Records
Tax History Compared to Growth
Tax History
| Year | Tax Paid | Tax Assessment Tax Assessment Total Assessment is a certain percentage of the fair market value that is determined by local assessors to be the total taxable value of land and additions on the property. | Land | Improvement |
|---|---|---|---|---|
| 2024 | $2,475 | $76,665 | $3,000 | $73,665 |
| 2023 | $2,421 | $76,665 | $3,000 | $73,665 |
| 2022 | $2,342 | $76,665 | $3,000 | $73,665 |
| 2021 | $2,212 | $60,168 | $3,000 | $57,168 |
| 2020 | $2,212 | $60,168 | $3,000 | $57,168 |
| 2019 | $2,212 | $60,168 | $3,000 | $57,168 |
| 2018 | $2,225 | $60,168 | $3,000 | $57,168 |
| 2017 | $2,195 | $60,168 | $3,000 | $57,168 |
| 2016 | $2,100 | $57,920 | $4,600 | $53,320 |
| 2015 | $2,100 | $57,920 | $4,600 | $53,320 |
| 2014 | $195 | $4,600 | $4,600 | $0 |
Source: Public Records
Map
Nearby Homes
- 1401 Roe's Ridge
- 1602 Roe's Ridge
- 1412 Ridgefield Dr
- 404 Trailwood Dr
- Lot 26 Scenic Place
- 209 Trailwood Dr
- 863 Copperfield Cove
- 705 N Park St
- 2195 Achoma Dr
- 1835 Heber Springs Rd N
- 710 N Broadway St
- 307 Lo Hawk Dr
- 429 E Moore St
- 502 E Clinton St
- 000 Arkansas 25 Bypass
- 2255 Highway 25b
- 508 Mustang Dr
- 2421 Hwy 25b N
- 610 N 2nd St
- 000 Wedding Ford Rd
- 805 Summer Heights Dr
- 807 approx Summer Heights
- 802 Summer Heights Dr
- 715 Summer Heights Dr
- 1402 N Scenic Dr
- 720 Summer Heights Dr
- 806 Summer Heights Dr
- 1409 Summer Trail Dr
- 1408 Summer Trail
- 0 Summer Heights Dr
- 716 Summer Heights Dr
- 1406 Summer Heights Dr
- 1401 Summer Heights Dr
- 00 N Scenic Dr
- 1408 Summer Trail Dr
- 0 Summer Trail
- 1413 Summer Trail Dr
- 1413 Summer Trail
- 707 Summer Heights Dr
- 1403 Summer Heights Dr