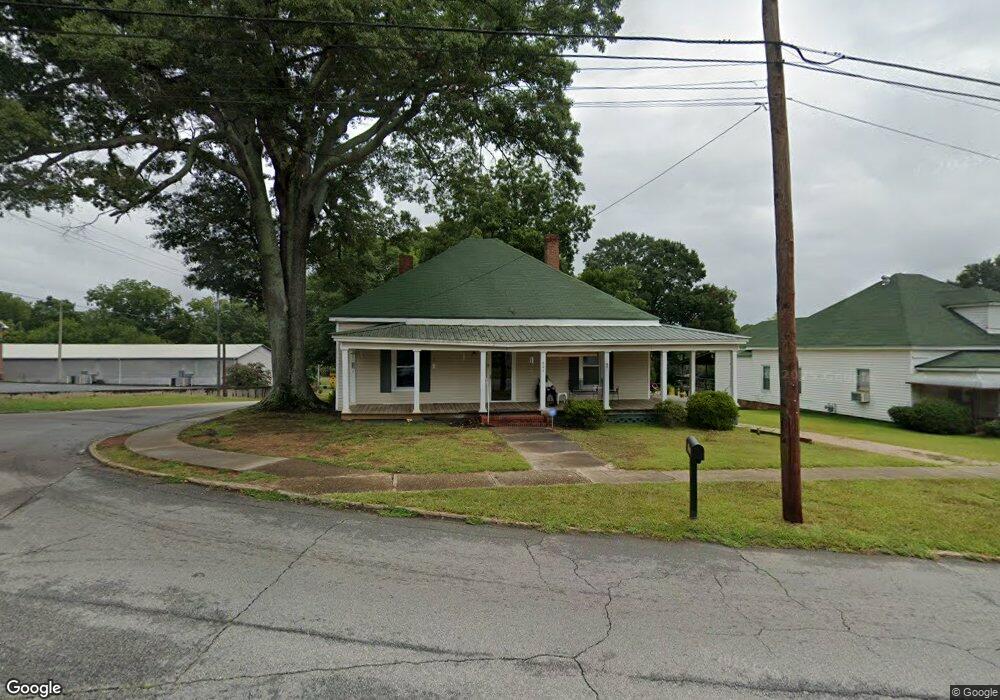
801 Truitt Ave Lagrange, GA 30240
Estimated Value: $147,000 - $161,000
4
Beds
2
Baths
2,411
Sq Ft
$64/Sq Ft
Est. Value
About This Home
This home is located at 801 Truitt Ave, Lagrange, GA 30240 and is currently estimated at $155,033, approximately $64 per square foot. 801 Truitt Ave is a home located in Troup County with nearby schools including Ethel W. Kight Elementary School, Hollis Hand Elementary School, and Franklin Forest Elementary School.
Ownership History
Date
Name
Owned For
Owner Type
Purchase Details
Closed on
Mar 1, 2023
Sold by
Ison Melva R
Bought by
Crowley Alfred Dewayne and Ison Melva R
Current Estimated Value
Purchase Details
Closed on
Oct 20, 2017
Sold by
Pittman Hubert Lee
Bought by
Ison Melva R
Home Financials for this Owner
Home Financials are based on the most recent Mortgage that was taken out on this home.
Original Mortgage
$79,500
Interest Rate
3.83%
Mortgage Type
New Conventional
Purchase Details
Closed on
Apr 1, 1986
Sold by
Bank Of Madison
Bought by
Pittman Hubert Lee
Purchase Details
Closed on
Jan 23, 1986
Sold by
Kirby James H
Bought by
Bank Of Madison
Purchase Details
Closed on
Jan 22, 1986
Sold by
Lois P Kirby
Bought by
Kirby James H
Purchase Details
Closed on
Nov 1, 1951
Sold by
Kirby Ed B and Kirby Lois P
Bought by
Lois P Kirby
Create a Home Valuation Report for This Property
The Home Valuation Report is an in-depth analysis detailing your home's value as well as a comparison with similar homes in the area
Purchase History
| Date | Buyer | Sale Price | Title Company |
|---|---|---|---|
| Crowley Alfred Dewayne | -- | -- | |
| Ison Melva R | $79,500 | -- | |
| Pittman Hubert Lee | -- | -- | |
| Bank Of Madison | $26,000 | -- | |
| Kirby James H | -- | -- | |
| Lois P Kirby | -- | -- |
Source: Public Records
Mortgage History
| Date | Status | Borrower | Loan Amount |
|---|---|---|---|
| Previous Owner | Ison Melva R | $79,500 |
Source: Public Records
Tax History
| Year | Tax Paid | Tax Assessment Tax Assessment Total Assessment is a certain percentage of the fair market value that is determined by local assessors to be the total taxable value of land and additions on the property. | Land | Improvement |
|---|---|---|---|---|
| 2025 | $770 | $59,936 | $3,160 | $56,776 |
| 2024 | $532 | $46,416 | $3,160 | $43,256 |
| 2023 | $421 | $42,336 | $3,160 | $39,176 |
| 2022 | $362 | $38,256 | $3,160 | $35,096 |
| 2021 | $800 | $34,276 | $3,160 | $31,116 |
| 2020 | $800 | $34,276 | $3,160 | $31,116 |
| 2019 | $707 | $31,176 | $3,160 | $28,016 |
| 2018 | $707 | $31,176 | $3,160 | $28,016 |
| 2017 | $873 | $30,920 | $2,800 | $28,120 |
| 2016 | $844 | $29,965 | $2,800 | $27,165 |
| 2015 | $857 | $30,345 | $3,180 | $27,165 |
| 2014 | $815 | $28,916 | $3,180 | $25,735 |
| 2013 | -- | $29,974 | $3,180 | $26,794 |
Source: Public Records
Map
Nearby Homes
- 207 Wilkes St
- 509 S Lewis St
- 505 S Lewis St
- 600 Park Ave
- 914 Todd St
- 501 Milam St
- 304 Boulevard
- 421 College Ave
- 606 Poplar St
- 303 E Mulberry St
- 405 W Broome St Unit 2
- 405 W Broome St Unit 3
- 405 W Broome St Unit 4
- 405 W Broome St Unit 1
- 405 W Broome St Unit 5
- 208 Boulevard
- 812 Elm St
- 403 College Ave
- 119 College Ave
- 1186 Lindsey St
- 803 Truitt Ave
- 714 S Greenwood St
- 301 Miller St
- 809 Truitt Ave
- 712 S Greenwood St
- 808 Truitt Ave
- 804 Leeman St
- 411 Miller St
- 410 Miller St
- 811 Truitt Ave
- 806 Leeman St
- 611 Harwell Ave
- 413 Miller St
- 813 Truitt Ave
- 710 S Greenwood St
- 609 Harwell Ave
- 808 Leeman St
- 208 Miller St
- 409 Miller St Unit 1
- 409 Miller St
Your Personal Tour Guide
Ask me questions while you tour the home.