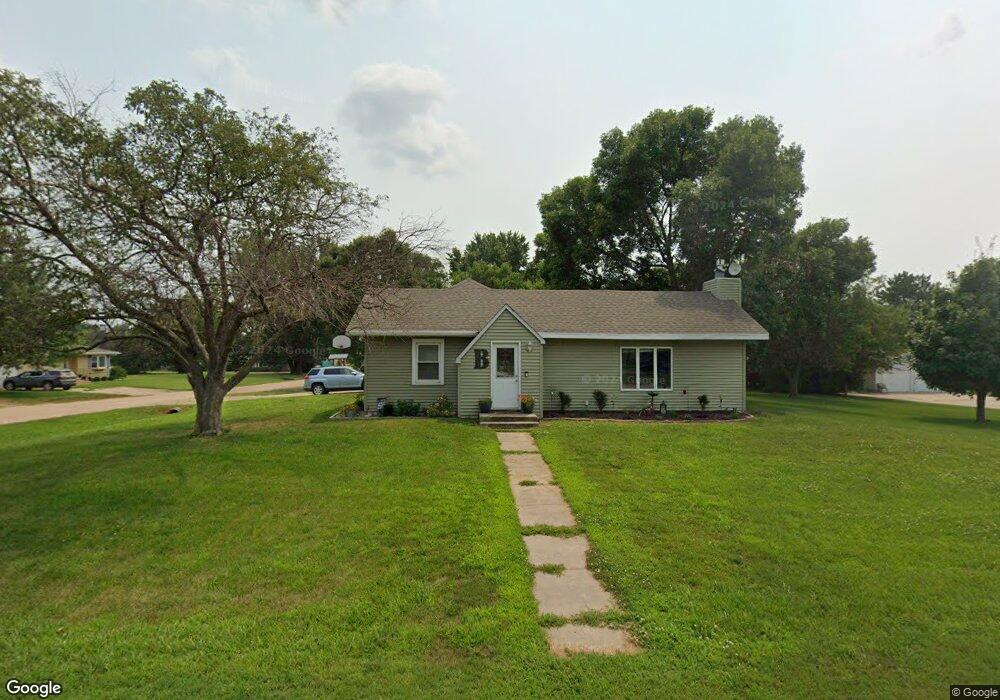
801 W 10th St Neligh, NE 68756
Estimated Value: $143,000 - $152,000
3
Beds
1
Bath
1,220
Sq Ft
$121/Sq Ft
Est. Value
About This Home
This home is located at 801 W 10th St, Neligh, NE 68756 and is currently estimated at $147,867, approximately $121 per square foot. 801 W 10th St is a home located in Antelope County.
Ownership History
Date
Name
Owned For
Owner Type
Purchase Details
Closed on
Mar 14, 2025
Sold by
Buck Kenzie M and Buck Nathaniel D
Bought by
Good Patricia
Current Estimated Value
Purchase Details
Closed on
Nov 22, 2021
Sold by
Starkey Robert D and Starkey Corrie L
Bought by
Buck Kenzie M and Buck Nathaniel D
Home Financials for this Owner
Home Financials are based on the most recent Mortgage that was taken out on this home.
Original Mortgage
$126,262
Interest Rate
2.99%
Mortgage Type
New Conventional
Purchase Details
Closed on
Nov 8, 2005
Bought by
Long Corrie L
Create a Home Valuation Report for This Property
The Home Valuation Report is an in-depth analysis detailing your home's value as well as a comparison with similar homes in the area
Home Values in the Area
Average Home Value in this Area
Purchase History
| Date | Buyer | Sale Price | Title Company |
|---|---|---|---|
| Good Patricia | $154,000 | None Listed On Document | |
| Good Patricia | $154,000 | None Listed On Document | |
| Buck Kenzie M | $123,000 | New Title Company Name | |
| Long Corrie L | $59,000 | -- |
Source: Public Records
Mortgage History
| Date | Status | Borrower | Loan Amount |
|---|---|---|---|
| Previous Owner | Buck Kenzie M | $126,262 |
Source: Public Records
Tax History Compared to Growth
Tax History
| Year | Tax Paid | Tax Assessment Tax Assessment Total Assessment is a certain percentage of the fair market value that is determined by local assessors to be the total taxable value of land and additions on the property. | Land | Improvement |
|---|---|---|---|---|
| 2024 | $1,426 | $105,520 | $10,300 | $95,220 |
| 2023 | $1,767 | $90,275 | $8,850 | $81,425 |
| 2022 | $1,586 | $78,820 | $5,900 | $72,920 |
| 2021 | $1,578 | $78,820 | $5,900 | $72,920 |
| 2020 | $1,403 | $67,910 | $5,900 | $62,010 |
| 2019 | $1,316 | $66,355 | $1,945 | $64,410 |
| 2018 | $1,281 | $66,355 | $1,945 | $64,410 |
| 2017 | $1,269 | $66,355 | $1,945 | $64,410 |
| 2016 | $1,227 | $66,355 | $1,945 | $64,410 |
| 2015 | $1,124 | $59,730 | $1,945 | $57,785 |
| 2014 | $1,228 | $58,345 | $1,945 | $56,400 |
Source: Public Records
Map
Nearby Homes