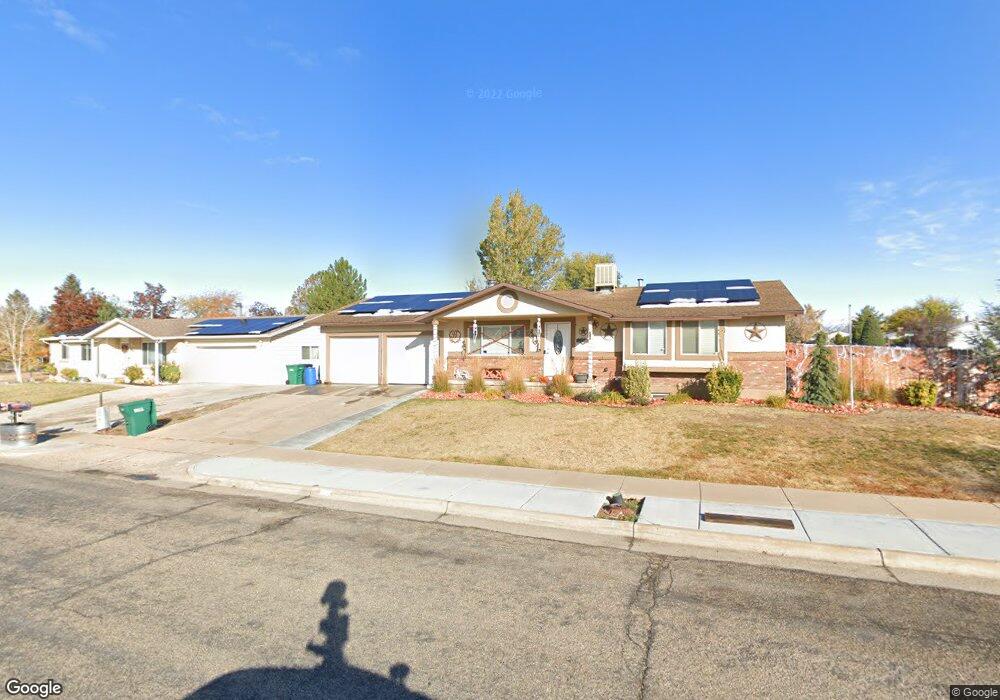
801 W 600 N Clearfield, UT 84015
Estimated Value: $429,000 - $446,864
6
Beds
2
Baths
2,251
Sq Ft
$195/Sq Ft
Est. Value
About This Home
This home is located at 801 W 600 N, Clearfield, UT 84015 and is currently estimated at $439,466, approximately $195 per square foot. 801 W 600 N is a home located in Davis County with nearby schools including Doxey School, North Davis Junior High School, and Clearfield High School.
Ownership History
Date
Name
Owned For
Owner Type
Purchase Details
Closed on
Feb 3, 2023
Sold by
Bruce Haylee
Bought by
Bruce Dave B
Current Estimated Value
Home Financials for this Owner
Home Financials are based on the most recent Mortgage that was taken out on this home.
Original Mortgage
$116,290
Outstanding Balance
$102,140
Interest Rate
5.69%
Mortgage Type
New Conventional
Estimated Equity
$337,326
Purchase Details
Closed on
Jun 10, 2002
Sold by
Shiba Jason C
Bought by
Shiba Jason C
Create a Home Valuation Report for This Property
The Home Valuation Report is an in-depth analysis detailing your home's value as well as a comparison with similar homes in the area
Home Values in the Area
Average Home Value in this Area
Purchase History
| Date | Buyer | Sale Price | Title Company |
|---|---|---|---|
| Bruce Dave B | -- | -- | |
| Shiba Jason C | -- | Associated Title Company |
Source: Public Records
Mortgage History
| Date | Status | Borrower | Loan Amount |
|---|---|---|---|
| Open | Bruce Dave B | $116,290 |
Source: Public Records
Tax History Compared to Growth
Tax History
| Year | Tax Paid | Tax Assessment Tax Assessment Total Assessment is a certain percentage of the fair market value that is determined by local assessors to be the total taxable value of land and additions on the property. | Land | Improvement |
|---|---|---|---|---|
| 2025 | $2,676 | $239,800 | $69,982 | $169,818 |
| 2024 | $2,571 | $232,100 | $66,896 | $165,204 |
| 2023 | $2,384 | $395,000 | $106,925 | $288,075 |
| 2022 | $2,516 | $225,500 | $61,116 | $164,384 |
| 2021 | $2,194 | $297,000 | $65,605 | $231,395 |
| 2020 | $1,911 | $257,000 | $55,290 | $201,710 |
| 2019 | $1,853 | $246,000 | $57,514 | $188,486 |
| 2018 | $1,663 | $215,000 | $51,049 | $163,951 |
| 2016 | $1,439 | $97,295 | $20,434 | $76,861 |
| 2015 | $1,373 | $88,495 | $20,434 | $68,061 |
| 2014 | $1,306 | $85,303 | $20,434 | $64,869 |
| 2013 | -- | $66,581 | $25,394 | $41,187 |
Source: Public Records
Map
Nearby Homes
- 561 N 700 W
- 721 N 800 W
- 853 W 700 N
- 690 Barlow St
- 762 W 300 N
- 777 W 300 N
- 652 W 800 N Unit 131
- 652 W 800 N Unit 62
- 288 N 825 W
- 620 N 1100 W
- Evergreen Plan at Ivie Meadows
- 274 N 825 W
- 341 W 750 N
- 1038 W 800 N
- 232 N Rick Way
- 228 N 500 W
- 482 W 275 N
- 417 N 1200 W Unit 84
- 482 Vickie Ln
- 303 N Canterbury Way