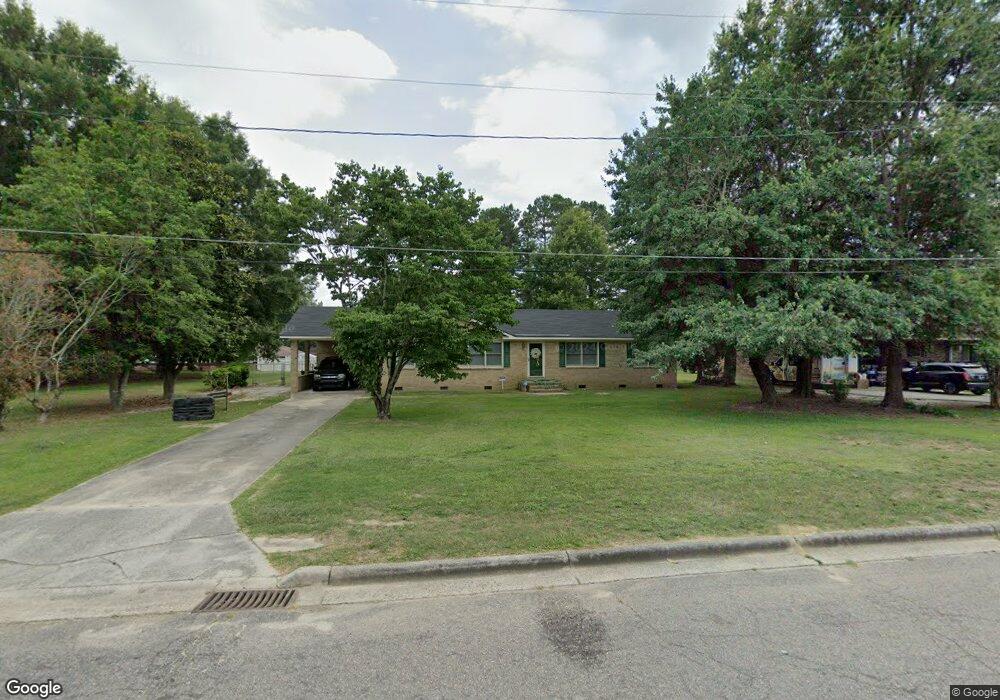
801 W Allen Ln Laurinburg, NC 28352
Estimated Value: $129,000 - $186,000
3
Beds
2
Baths
1,456
Sq Ft
$101/Sq Ft
Est. Value
About This Home
This home is located at 801 W Allen Ln, Laurinburg, NC 28352 and is currently estimated at $147,783, approximately $101 per square foot. 801 W Allen Ln is a home located in Scotland County with nearby schools including I E Johnson Elementary, Carver Middle School, and Scotland High School.
Ownership History
Date
Name
Owned For
Owner Type
Purchase Details
Closed on
Oct 5, 2006
Sold by
Federal Home Loan Corporation
Bought by
Willis J D and Willis Marie M
Current Estimated Value
Home Financials for this Owner
Home Financials are based on the most recent Mortgage that was taken out on this home.
Original Mortgage
$75,000
Outstanding Balance
$44,581
Interest Rate
6.39%
Mortgage Type
Future Advance Clause Open End Mortgage
Estimated Equity
$103,202
Purchase Details
Closed on
Aug 18, 2006
Sold by
Carter Alan and Shivers Carter Geraldine T
Bought by
Federal Home Loan Mortgage Corporation
Home Financials for this Owner
Home Financials are based on the most recent Mortgage that was taken out on this home.
Original Mortgage
$75,000
Outstanding Balance
$44,581
Interest Rate
6.39%
Mortgage Type
Future Advance Clause Open End Mortgage
Estimated Equity
$103,202
Create a Home Valuation Report for This Property
The Home Valuation Report is an in-depth analysis detailing your home's value as well as a comparison with similar homes in the area
Home Values in the Area
Average Home Value in this Area
Purchase History
| Date | Buyer | Sale Price | Title Company |
|---|---|---|---|
| Willis J D | -- | None Available | |
| Federal Home Loan Mortgage Corporation | $68,258 | None Available |
Source: Public Records
Mortgage History
| Date | Status | Borrower | Loan Amount |
|---|---|---|---|
| Open | Willis J D | $75,000 |
Source: Public Records
Tax History Compared to Growth
Tax History
| Year | Tax Paid | Tax Assessment Tax Assessment Total Assessment is a certain percentage of the fair market value that is determined by local assessors to be the total taxable value of land and additions on the property. | Land | Improvement |
|---|---|---|---|---|
| 2025 | $878 | $83,150 | $6,550 | $76,600 |
| 2024 | $870 | $83,150 | $6,550 | $76,600 |
| 2023 | $878 | $83,150 | $6,550 | $76,600 |
| 2022 | $878 | $83,150 | $6,550 | $76,600 |
| 2021 | $887 | $83,150 | $6,550 | $76,600 |
| 2020 | $878 | $83,150 | $6,550 | $76,600 |
| 2019 | $887 | $83,150 | $6,550 | $76,600 |
| 2018 | $948 | $89,270 | $6,550 | $82,720 |
| 2017 | $957 | $89,270 | $6,550 | $82,720 |
| 2016 | $966 | $89,270 | $6,550 | $82,720 |
| 2015 | $974 | $89,270 | $6,550 | $82,720 |
| 2014 | $919 | $0 | $0 | $0 |
Source: Public Records
Map
Nearby Homes
- 804 Durso St
- 009 Berry St
- 0 Produce Market Rd Unit LotWP001 16910819
- 0 Produce Market Rd
- 607 Washington St
- 201 Lee's Mill Rd
- 512 Produce Market Rd
- 914 Cliffdale Dr
- 16121 Palomino Rd
- 707 Aberdeen Rd
- 16081 Bronco Dr
- 902 Aberdeen Rd
- 817 Aberdeen Rd
- 17090 Old Lumberton Rd
- 220 N Pine St
- 17281 Old Lumberton Rd
- 17261 Harvell Ln
- 105 Sanford Rd
- 201 2nd St
- 421 Mckay St
- 709 W Allen Ln
- 904 Isabelle St
- 707 W Allen Ln
- 902 Isabelle St
- 906 Isabelle St
- 806 W Allen Ln
- 808 W Allen Ln
- 908 Isabelle St
- 807 W Allen Ln
- 702 W Allen Ln
- 810 W Allen Ln
- 910 Isabelle St
- 911 Isabelle St
- 903 Isabelle St
- 1003 Bryant St
- 809 W Allen Ln
- 705 W Allen Ln
- 907 Isabelle St
- 804 Isabelle St
- 808 Durso St