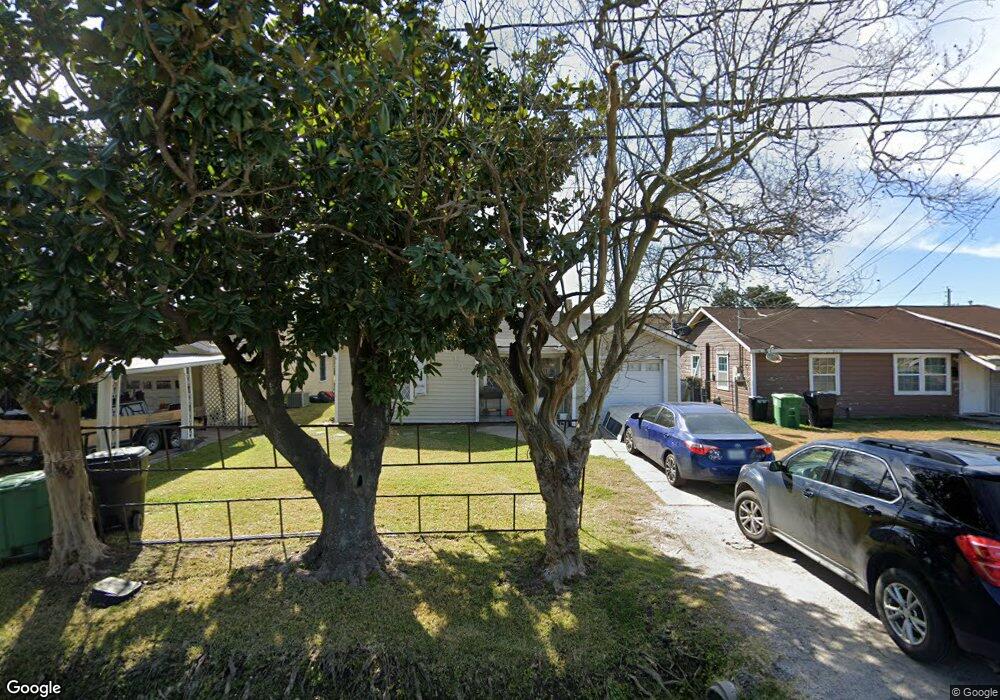
8010 Adrian St Houston, TX 77012
Pecan Park NeighborhoodEstimated Value: $169,702 - $199,000
2
Beds
1
Bath
810
Sq Ft
$225/Sq Ft
Est. Value
About This Home
This home is located at 8010 Adrian St, Houston, TX 77012 and is currently estimated at $182,426, approximately $225 per square foot. 8010 Adrian St is a home located in Harris County with nearby schools including Sanchez Elementary School, Milby High School, and Houston Gateway Academy - Coral Campus.
Ownership History
Date
Name
Owned For
Owner Type
Purchase Details
Closed on
Jan 20, 2006
Sold by
Fannie Mae
Bought by
Alvarado Sergio V
Current Estimated Value
Home Financials for this Owner
Home Financials are based on the most recent Mortgage that was taken out on this home.
Original Mortgage
$59,900
Interest Rate
6.22%
Mortgage Type
Fannie Mae Freddie Mac
Purchase Details
Closed on
Jun 7, 2005
Sold by
Flores Jose E
Bought by
Federal National Mortgage Association
Purchase Details
Closed on
May 31, 1996
Sold by
Kharbat Adel A
Bought by
Flores Jose E
Home Financials for this Owner
Home Financials are based on the most recent Mortgage that was taken out on this home.
Original Mortgage
$43,650
Interest Rate
7.92%
Purchase Details
Closed on
Jun 22, 1995
Sold by
Miller Matt and Hoff Lawrence C
Bought by
Kharbat Adel A
Create a Home Valuation Report for This Property
The Home Valuation Report is an in-depth analysis detailing your home's value as well as a comparison with similar homes in the area
Home Values in the Area
Average Home Value in this Area
Purchase History
| Date | Buyer | Sale Price | Title Company |
|---|---|---|---|
| Alvarado Sergio V | -- | Texas American Title Company | |
| Federal National Mortgage Association | $58,243 | -- | |
| Flores Jose E | -- | Texas American Title Company | |
| Kharbat Adel A | -- | Stewart Title |
Source: Public Records
Mortgage History
| Date | Status | Borrower | Loan Amount |
|---|---|---|---|
| Previous Owner | Alvarado Sergio V | $59,900 | |
| Previous Owner | Flores Jose E | $43,650 |
Source: Public Records
Tax History Compared to Growth
Tax History
| Year | Tax Paid | Tax Assessment Tax Assessment Total Assessment is a certain percentage of the fair market value that is determined by local assessors to be the total taxable value of land and additions on the property. | Land | Improvement |
|---|---|---|---|---|
| 2025 | $1,451 | $154,148 | $70,700 | $83,448 |
| 2024 | $1,451 | $152,041 | $60,600 | $91,441 |
| 2023 | $1,451 | $152,041 | $60,600 | $91,441 |
| 2022 | $2,689 | $138,061 | $60,600 | $77,461 |
| 2021 | $2,422 | $110,187 | $35,350 | $74,837 |
| 2020 | $2,430 | $102,660 | $35,350 | $67,310 |
| 2019 | $2,302 | $107,015 | $35,350 | $71,665 |
| 2018 | $1,287 | $78,084 | $22,725 | $55,359 |
| 2017 | $2,053 | $78,084 | $22,725 | $55,359 |
| 2016 | $1,866 | $73,937 | $22,725 | $51,212 |
| 2015 | $1,011 | $73,937 | $22,725 | $51,212 |
| 2014 | $1,011 | $57,573 | $22,725 | $34,848 |
Source: Public Records
Map
Nearby Homes
- 7931 Scanlock St
- 7814 Glover St
- 7924 Elvera St
- 7707 Arberry St
- 7918 Anza Cir
- 2002 Broadway St
- 7920 Junius St
- 7908 John St
- 7506 Hemlock St
- 7303 Gulf Fwy Unit 903
- 8215 La Porte Rd
- 7313 Gulf Fwy Unit 814
- 7313 Gulf Fwy Unit 911
- 7313 Gulf Fwy Unit 1011
- 2511 Evergreen Dr
- 7306 Garden St
- 7119 Quince St
- 1301 Boulder St
- 8145 Easton St
- 7318 Dahlia St
- 8006 Adrian St
- 8014 Adrian St
- 8002 Adrian St
- 8011 Scanlock St
- 8015 Scanlock St
- 8007 Scanlock St
- 7934 Adrian St
- 8003 Scanlock St
- 7930 Adrian St
- 7926 Adrian St
- 8014 Keller St
- 7927 Scanlock St
- 8010 Keller St
- 8006 Keller St
- 7922 Adrian St
- 7923 Scanlock St
- 8002 Keller St
- 7923 Adrian St
- 7918 Adrian St
- 7919 Scanlock St