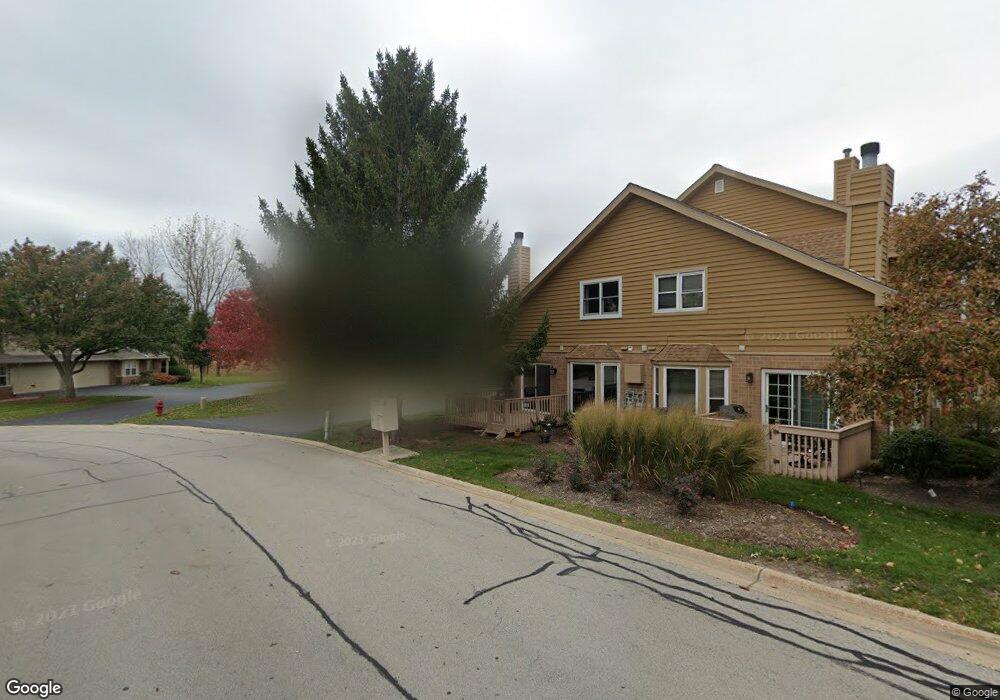
8010 Barrymore Dr Unit 391 Darien, IL 60561
Estimated Value: $391,000 - $437,052
2
Beds
3
Baths
2,080
Sq Ft
$204/Sq Ft
Est. Value
About This Home
This home is located at 8010 Barrymore Dr Unit 391, Darien, IL 60561 and is currently estimated at $424,263, approximately $203 per square foot. 8010 Barrymore Dr Unit 391 is a home located in DuPage County with nearby schools including Concord Elementary School, Cass Jr High School, and Hinsdale South High School.
Ownership History
Date
Name
Owned For
Owner Type
Purchase Details
Closed on
Aug 26, 2022
Sold by
Carr Thomas A and Chiricotti Maureen S
Bought by
Trust No 8010 and Carr
Current Estimated Value
Purchase Details
Closed on
Mar 30, 1999
Sold by
Forbes James L and Forbes Lori A
Bought by
Carr Thomas A
Home Financials for this Owner
Home Financials are based on the most recent Mortgage that was taken out on this home.
Original Mortgage
$100,000
Interest Rate
7.17%
Mortgage Type
Purchase Money Mortgage
Purchase Details
Closed on
Jun 28, 1995
Sold by
Forbes James L
Bought by
Forbes James L and Forbes Lori A
Home Financials for this Owner
Home Financials are based on the most recent Mortgage that was taken out on this home.
Original Mortgage
$157,300
Interest Rate
7.79%
Mortgage Type
Purchase Money Mortgage
Create a Home Valuation Report for This Property
The Home Valuation Report is an in-depth analysis detailing your home's value as well as a comparison with similar homes in the area
Home Values in the Area
Average Home Value in this Area
Purchase History
| Date | Buyer | Sale Price | Title Company |
|---|---|---|---|
| Trust No 8010 | -- | None Listed On Document | |
| Carr Thomas A | $222,000 | -- | |
| Forbes James L | -- | Lawyers Title |
Source: Public Records
Mortgage History
| Date | Status | Borrower | Loan Amount |
|---|---|---|---|
| Previous Owner | Carr Thomas A | $100,000 | |
| Previous Owner | Forbes James L | $157,300 |
Source: Public Records
Tax History Compared to Growth
Tax History
| Year | Tax Paid | Tax Assessment Tax Assessment Total Assessment is a certain percentage of the fair market value that is determined by local assessors to be the total taxable value of land and additions on the property. | Land | Improvement |
|---|---|---|---|---|
| 2024 | $7,517 | $132,635 | $30,991 | $101,644 |
| 2023 | $7,158 | $121,930 | $28,490 | $93,440 |
| 2022 | $6,527 | $108,760 | $25,410 | $83,350 |
| 2021 | $6,053 | $107,520 | $25,120 | $82,400 |
| 2020 | $6,252 | $105,390 | $24,620 | $80,770 |
| 2019 | $6,008 | $101,120 | $23,620 | $77,500 |
| 2018 | $5,884 | $101,120 | $23,620 | $77,500 |
| 2017 | $5,744 | $97,310 | $22,730 | $74,580 |
| 2016 | $5,604 | $92,870 | $21,690 | $71,180 |
| 2015 | $5,796 | $91,970 | $21,480 | $70,490 |
| 2014 | $5,700 | $89,420 | $20,880 | $68,540 |
| 2013 | $5,493 | $89,000 | $20,780 | $68,220 |
Source: Public Records
Map
Nearby Homes
- 7833 Darien Lake Dr
- 7829 Darien Lake Dr
- 7930 Grant St
- 1501 Darien Lake Dr Unit 305
- 7801 Pine Pkwy
- 1390 Marco Ct
- 1370 Marco Ct
- 125 Sherwood Ct
- 7704 Queens Ct
- 7713 Brookhaven Ave
- 500 Redondo Dr Unit 409
- 500 Redondo Dr Unit 308
- 1018 Bob-O-link Ln
- 502 Redondo Dr Unit 503
- 1623 Clemens Rd
- 9S211 Graceland St
- 505 Redondo Dr Unit 308
- 505 Redondo Dr Unit 305
- 2505 75th St
- 8408 Dawn Ln
- 39 Bailey Rd
- 8008 Barrymore Dr
- 8012 Barrymore Dr
- 8006 Barrymore Dr Unit 381
- 8004 Barrymore Dr Unit 384
- 8018 Barrymore Dr
- 8000 Barrymore Dr
- 8016 Barrymore Dr
- 8007 Barrymore Dr Unit 191
- 8003 Barrymore Dr
- 8003 Barrymore Dr Unit 8003
- 8030 Barrymore Dr Unit 371
- 8026 Barrymore Dr Unit 372
- 8034 Barrymore Dr
- 8005 Barrymore Dr
- 8038 Barrymore Dr
- 8001 Barrymore Dr Unit 193
- 8028 Barrymore Dr
- 8024 Barrymore Dr
- 8032 Barrymore Dr