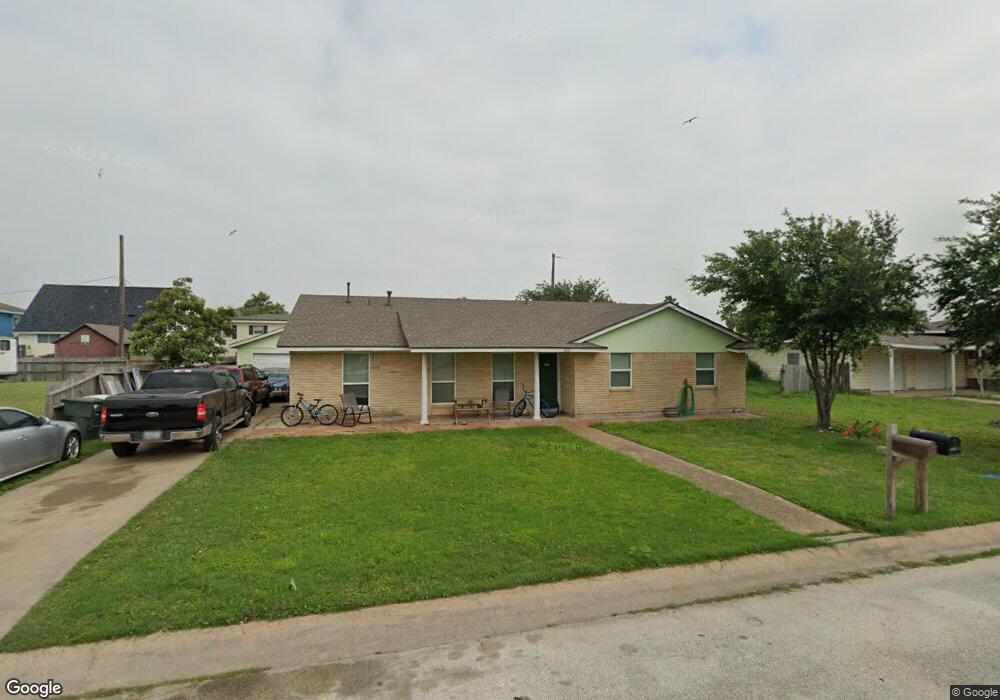
8010 Pruitt Dr Galveston, TX 77554
Estimated Value: $284,000 - $688,000
3
Beds
2
Baths
1,841
Sq Ft
$226/Sq Ft
Est. Value
About This Home
This home is located at 8010 Pruitt Dr, Galveston, TX 77554 and is currently estimated at $415,494, approximately $225 per square foot. 8010 Pruitt Dr is a home located in Galveston County with nearby schools including Parker Elementary School, Burnet STREAM Magnet School, and Morgan Elementary Magnet School.
Ownership History
Date
Name
Owned For
Owner Type
Purchase Details
Closed on
Jun 1, 2012
Sold by
Kastis Michael and Kastis Irene
Bought by
Nino Amy
Current Estimated Value
Home Financials for this Owner
Home Financials are based on the most recent Mortgage that was taken out on this home.
Original Mortgage
$114,000
Outstanding Balance
$79,376
Interest Rate
3.93%
Mortgage Type
New Conventional
Estimated Equity
$336,118
Purchase Details
Closed on
Jan 28, 2010
Sold by
Butler Robert J and Butler Carolyn A
Bought by
Kastis Michel
Purchase Details
Closed on
Aug 3, 2001
Sold by
Bellard Nina B
Bought by
Butler Robert J and Butler Carolyn A
Home Financials for this Owner
Home Financials are based on the most recent Mortgage that was taken out on this home.
Original Mortgage
$87,840
Interest Rate
7.05%
Mortgage Type
Purchase Money Mortgage
Create a Home Valuation Report for This Property
The Home Valuation Report is an in-depth analysis detailing your home's value as well as a comparison with similar homes in the area
Home Values in the Area
Average Home Value in this Area
Purchase History
| Date | Buyer | Sale Price | Title Company |
|---|---|---|---|
| Nino Amy | -- | First American Title | |
| Kastis Michel | -- | Southland Title Company | |
| Butler Robert J | -- | Southland Title Company |
Source: Public Records
Mortgage History
| Date | Status | Borrower | Loan Amount |
|---|---|---|---|
| Open | Nino Amy | $114,000 | |
| Previous Owner | Butler Robert J | $87,840 |
Source: Public Records
Tax History Compared to Growth
Tax History
| Year | Tax Paid | Tax Assessment Tax Assessment Total Assessment is a certain percentage of the fair market value that is determined by local assessors to be the total taxable value of land and additions on the property. | Land | Improvement |
|---|---|---|---|---|
| 2025 | $2,520 | $259,912 | $20,850 | $239,062 |
| 2024 | $2,520 | $246,177 | -- | -- |
| 2023 | $2,520 | $223,797 | $0 | $0 |
| 2022 | $4,102 | $203,452 | $0 | $0 |
| 2021 | $4,184 | $304,740 | $23,100 | $281,640 |
| 2020 | $4,030 | $204,140 | $23,100 | $181,040 |
| 2019 | $3,769 | $173,530 | $23,100 | $150,430 |
| 2018 | $3,439 | $138,960 | $23,100 | $115,860 |
| 2017 | $3,436 | $140,540 | $23,100 | $117,440 |
| 2016 | $3,436 | $140,520 | $23,100 | $117,420 |
| 2015 | $2,493 | $140,520 | $23,100 | $117,420 |
| 2014 | $2,645 | $140,520 | $23,100 | $117,420 |
Source: Public Records
Map
Nearby Homes
- 430 81st St
- 8510 Old Causeway Rd
- 8407 Teichman Rd
- 8111 Broadway St Unit 5
- 8509 Teichman Rd
- 1026 Lillian Ln
- 508 91st St
- 726 91st St
- 9115 W Bay Dr
- 9208 W Bay Rd
- 9705 Teichman Rd
- 7123 Broadway St
- 7105 Broadway St
- 806 93rd St
- 1019 Palm Cove Ct
- 9309 Vista Bella Dr
- 1003 Bamar Ln
- 1001 Bamar Ln
- 710 Vista Bella
- 714 Vista Bella Dr
- 8018 Pruitt Dr
- 8002 Pruitt Dr
- 8009 Channelview Dr
- 8015 Channelview Dr
- 8007 Channelview Dr
- 8017 Channelview Dr
- 8022 Pruitt Dr
- 8023 Pruitt Dr
- 8021 Channelview Dr
- 7928 Pruitt Dr
- 8027 Pruitt Dr
- 9717 Pruitt Dr
- 7925 Pruitt Dr
- 426 81st St
- 8003 Channelview Dr
- 7918 Pruitt Dr
- 7917 Pruitt Dr
- 000 81st
- 8020 Channelview Dr
- 414 81st St