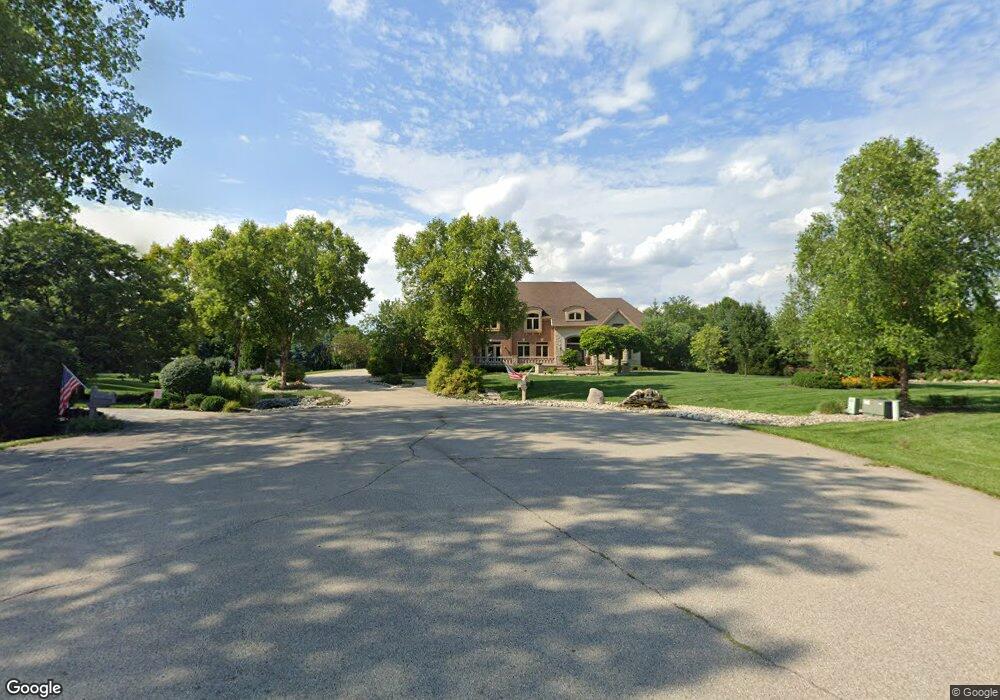
8010 Tall Trees Ct Springboro, OH 45066
Estimated Value: $1,480,000 - $1,645,000
4
Beds
6
Baths
5,154
Sq Ft
$304/Sq Ft
Est. Value
About This Home
This home is located at 8010 Tall Trees Ct, Springboro, OH 45066 and is currently estimated at $1,567,873, approximately $304 per square foot. 8010 Tall Trees Ct is a home located in Warren County with nearby schools including Clearcreek Elementary School, Springboro Intermediate School, and Springboro Junior High School.
Ownership History
Date
Name
Owned For
Owner Type
Purchase Details
Closed on
Oct 11, 2012
Sold by
Lytle Patrick J and The Patrick J Lytle Living Tru
Bought by
Cook Thomas M and Cook Karen L
Current Estimated Value
Home Financials for this Owner
Home Financials are based on the most recent Mortgage that was taken out on this home.
Original Mortgage
$303,000
Outstanding Balance
$201,534
Interest Rate
2.99%
Mortgage Type
Adjustable Rate Mortgage/ARM
Estimated Equity
$1,366,339
Purchase Details
Closed on
Jul 2, 2010
Sold by
Lytle Patrick J and Lytle Patrick James
Bought by
Lytle Patrick J and Patrick J Lytle Living Trust
Purchase Details
Closed on
Jan 11, 2010
Sold by
Lytle Nancy L and Lytle Nancy Lynn
Bought by
Lytle Patrick J and Lytle Patrick James
Home Financials for this Owner
Home Financials are based on the most recent Mortgage that was taken out on this home.
Original Mortgage
$103,500
Interest Rate
5.2%
Mortgage Type
New Conventional
Create a Home Valuation Report for This Property
The Home Valuation Report is an in-depth analysis detailing your home's value as well as a comparison with similar homes in the area
Home Values in the Area
Average Home Value in this Area
Purchase History
| Date | Buyer | Sale Price | Title Company |
|---|---|---|---|
| Cook Thomas M | $900,000 | None Available | |
| Lytle Patrick J | -- | Attorney | |
| Lytle Patrick J | -- | First American |
Source: Public Records
Mortgage History
| Date | Status | Borrower | Loan Amount |
|---|---|---|---|
| Open | Cook Thomas M | $303,000 | |
| Previous Owner | Lytle Patrick J | $103,500 |
Source: Public Records
Tax History
| Year | Tax Paid | Tax Assessment Tax Assessment Total Assessment is a certain percentage of the fair market value that is determined by local assessors to be the total taxable value of land and additions on the property. | Land | Improvement |
|---|---|---|---|---|
| 2025 | $21,623 | $526,140 | $105,000 | $421,140 |
| 2024 | $21,623 | $526,140 | $105,000 | $421,140 |
| 2023 | $19,078 | $422,366 | $61,950 | $360,416 |
| 2022 | $18,807 | $422,366 | $61,950 | $360,416 |
| 2021 | $17,575 | $422,366 | $61,950 | $360,416 |
| 2020 | $17,078 | $357,938 | $52,500 | $305,438 |
| 2019 | $15,802 | $357,938 | $52,500 | $305,438 |
| 2018 | $15,658 | $357,938 | $52,500 | $305,438 |
| 2017 | $15,792 | $320,880 | $43,761 | $277,120 |
| 2016 | $16,377 | $320,880 | $43,761 | $277,120 |
| 2015 | $16,084 | $320,880 | $43,761 | $277,120 |
| 2014 | $16,084 | $299,890 | $40,900 | $258,990 |
| 2013 | $16,077 | $384,970 | $52,500 | $332,470 |
Source: Public Records
Map
Nearby Homes
- 8301 Red Lion 5 Points Rd
- 22 Patton Dr
- 251 Fallen Leaf Ct
- 7545 Deer Path Ct
- 7412 Larkspur Ct
- 34 Chestnut St
- 28 Chestnut St
- 40 Chestnut St
- 22 Chestnut St
- 46 Chestnut St
- 10 Chestnut St
- 55 Chestnut St
- 85 Chestnut St
- 65 Chestnut St
- 15 Magnolia Ln
- 75 Chestnut St
- 165 Magnolia Ln
- 155 Magnolia Ln
- 58 Chestnut St
- 7293 Stone Ridge Dr
- 8001 Tall Trees Ct
- 7991 Old Woods Ct
- 8092 Forest Glen Dr
- 8105 Old Woods Ct
- 8068 Forest Glen Dr
- 8079 Old Woods Ct
- 8131 Old Woods Ct
- 7993 Tall Trees Ct
- 8023 Old Woods Ct
- 8046 Forest Glen Dr
- 8165 Old Woods Ct
- 7879 Old Woods Ct
- 7960 Woodbridge Ct
- 8207 Old Woods Ct
- 8000 Old Woods Ct
- 7986 Woodbridge Ct
- 7938 Woodbridge Ct
- 7998 Woodbridge Ct
- 7941 Tall Trees Ct
- 202 Loganwood Ct
Your Personal Tour Guide
Ask me questions while you tour the home.