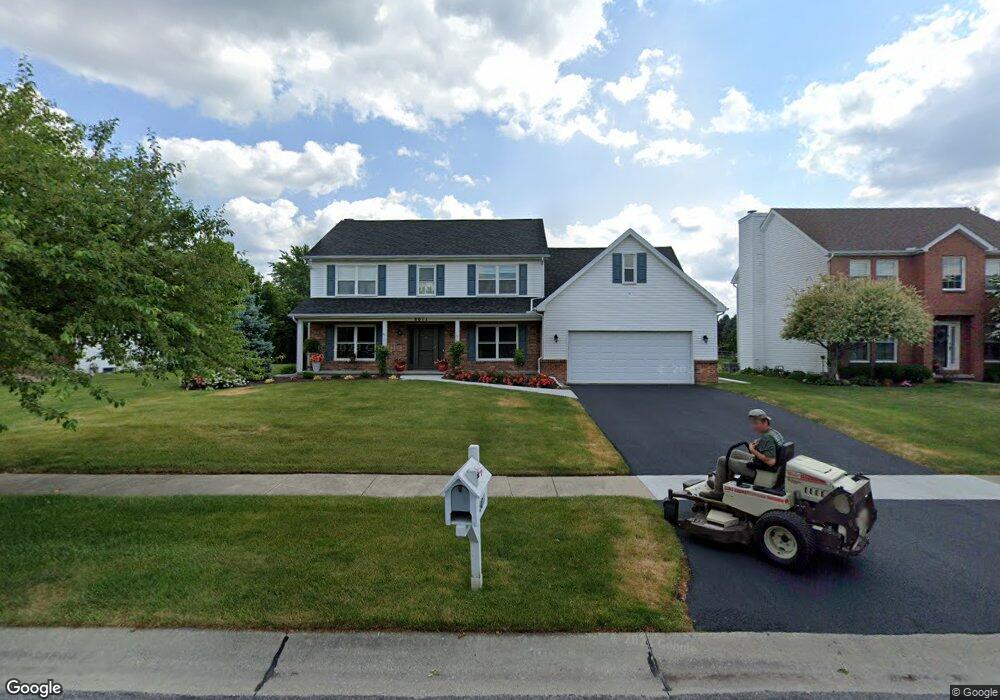
8011 Eagle Creek Ct Sylvania, OH 43560
Estimated Value: $388,621 - $419,000
4
Beds
3
Baths
2,730
Sq Ft
$148/Sq Ft
Est. Value
About This Home
This home is located at 8011 Eagle Creek Ct, Sylvania, OH 43560 and is currently estimated at $405,155, approximately $148 per square foot. 8011 Eagle Creek Ct is a home located in Lucas County with nearby schools including Highland Elementary School, Sylvania McCord Junior High School, and Sylvania Northview High School.
Ownership History
Date
Name
Owned For
Owner Type
Purchase Details
Closed on
Mar 1, 2022
Sold by
Debelly Roger D and Debelly Sharon A
Bought by
Sharon A Debelly Trust
Current Estimated Value
Purchase Details
Closed on
Mar 31, 1997
Sold by
Brown Thomas J
Bought by
Debelly Roger D and Debelly Sharon A
Home Financials for this Owner
Home Financials are based on the most recent Mortgage that was taken out on this home.
Original Mortgage
$204,200
Interest Rate
5.75%
Mortgage Type
New Conventional
Purchase Details
Closed on
Jun 11, 1996
Sold by
Brown Thomas J
Bought by
Gaston Robie and Gaston Noma M
Purchase Details
Closed on
Sep 25, 1995
Sold by
Louisville Title Agency
Bought by
Tom Brown Custom Homes
Home Financials for this Owner
Home Financials are based on the most recent Mortgage that was taken out on this home.
Original Mortgage
$83,025
Interest Rate
7.78%
Mortgage Type
New Conventional
Create a Home Valuation Report for This Property
The Home Valuation Report is an in-depth analysis detailing your home's value as well as a comparison with similar homes in the area
Home Values in the Area
Average Home Value in this Area
Purchase History
| Date | Buyer | Sale Price | Title Company |
|---|---|---|---|
| Sharon A Debelly Trust | -- | Udell Law | |
| Debelly Roger D | $215,000 | -- | |
| Gaston Robie | $217,500 | -- | |
| Tom Brown Custom Homes | $107,700 | -- |
Source: Public Records
Mortgage History
| Date | Status | Borrower | Loan Amount |
|---|---|---|---|
| Previous Owner | Debelly Roger D | $204,200 | |
| Previous Owner | Tom Brown Custom Homes | $83,025 |
Source: Public Records
Tax History
| Year | Tax Paid | Tax Assessment Tax Assessment Total Assessment is a certain percentage of the fair market value that is determined by local assessors to be the total taxable value of land and additions on the property. | Land | Improvement |
|---|---|---|---|---|
| 2025 | -- | $134,120 | $19,810 | $114,310 |
| 2024 | $4,214 | $134,120 | $19,810 | $114,310 |
| 2023 | $7,809 | $108,255 | $16,555 | $91,700 |
| 2022 | $7,820 | $108,255 | $16,555 | $91,700 |
| 2021 | $8,026 | $108,255 | $16,555 | $91,700 |
| 2020 | $7,586 | $90,860 | $13,440 | $77,420 |
| 2019 | $7,295 | $90,860 | $13,440 | $77,420 |
| 2018 | $6,714 | $90,860 | $13,440 | $77,420 |
| 2017 | $6,666 | $75,740 | $11,935 | $63,805 |
| 2016 | $6,533 | $216,400 | $34,100 | $182,300 |
| 2015 | $6,144 | $216,400 | $34,100 | $182,300 |
| 2014 | $5,758 | $72,840 | $11,480 | $61,360 |
| 2013 | $5,758 | $72,840 | $11,480 | $61,360 |
Source: Public Records
Map
Nearby Homes
- 5462 Deercross Ct
- 7557 Rymoor Ct
- 5310 Turnberry Ln
- 5902 Apple Meadow Dr
- 7924 Harrow Ct
- 5955 Hawthorne Dr
- 7548 Red Pines Dr
- 5862 Summer Place Dr
- 6302 Brint Rd
- 6322 Brint Rd
- 6332 Brint Rd
- 6312 Brint Rd
- 6046 Centennial Rd
- 8631 Stone Post Rd
- 8329 Ledgestone Ave Unit 8329
- 8800 Harlow Ct
- 5131 Rock Creek Dr
- 8827 Flint Ct
- 8819 Flint Ct
- 8811 Flint Ct
- 8019 Eagle Creek Ct
- 8003 Eagle Creek Ct
- 8027 Eagle Creek Ct
- 7812 Little Rd
- 7820 Little Rd
- 7802 Little Rd
- 8035 Eagle Creek Ct
- 7828 Little Rd
- 8004 Eagle Creek Ct
- 8014 Eagle Creek Ct
- 8022 Eagle Creek Ct
- 7836 Little Rd
- 5424 Eagle Trace Dr
- 5416 Eagle Trace Dr
- 8043 Eagle Creek Ct
- 8030 Eagle Creek Ct
- 5432 Eagle Trace Dr
- 7754 Little Rd
- 5440 Eagle Trace Dr
- 8038 Eagle Creek Ct
Your Personal Tour Guide
Ask me questions while you tour the home.