8011 S 800 W Fairmount, IN 46928
Estimated payment $567/month
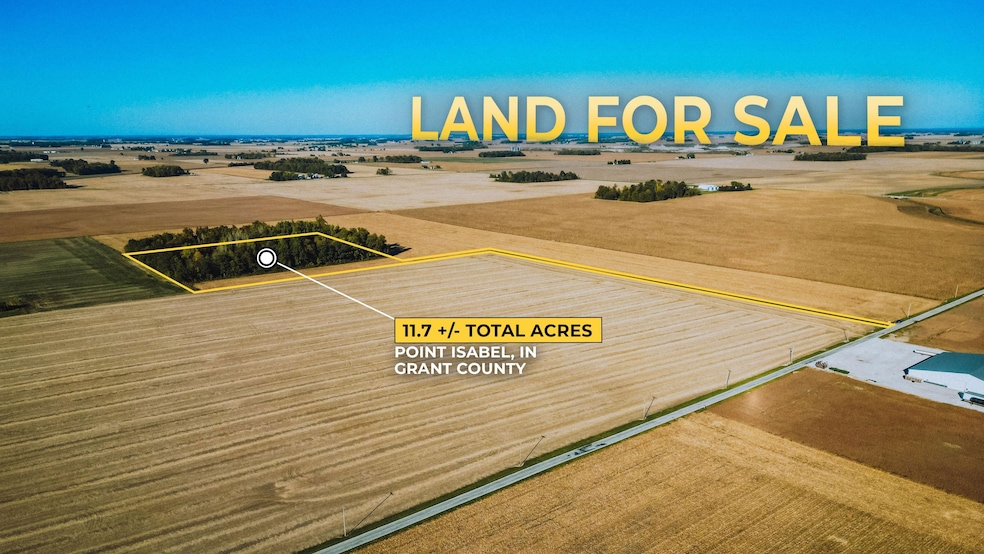
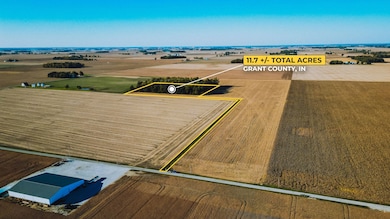
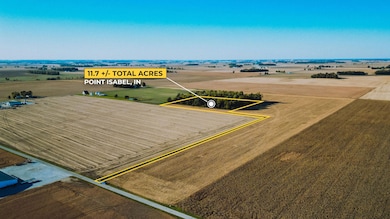
About This Lot
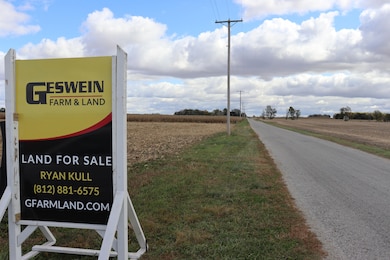
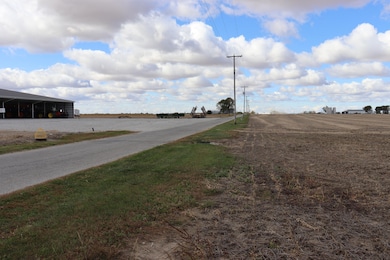
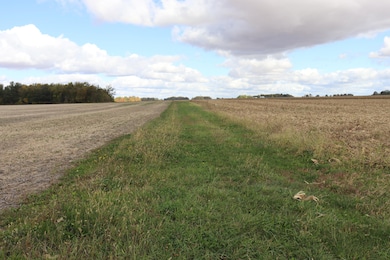
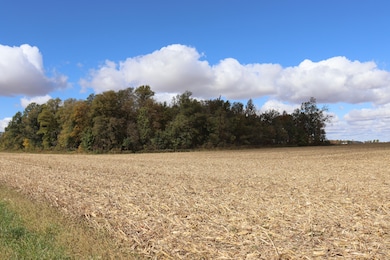
This 12 +/- acre property is a rare find for those seeking a tranquil escape in nature. With 8 +/- acres of lush, wooded terrain, it offers a beautiful and serene environment perfect for hunting, camping, or simply exploring the outdoors. The dense canopy provides ample cover for wildlife, making it an ideal spot for those looking to hunt or observe nature in a peaceful, private setting. Accessible via a paved road from Highway 13 via county road 800 and located conveniently near Highway 26, the property combines seclusion with easy reach. Plus, it's just a short drive from Point Isabel, adding even more to its appeal as a weekend getaway or long-term investment. Whether you're looking to set up a campsite, or just enjoy the beauty of the woods, this property offers endless possibilities for outdoor enthusiasts. UPDATE: SELLER WILL INSTALL ELECTRIC AND WATER AFTER HARVEST. Estimated to save the buyer $25,000-30,000!

Property Details
Property Type
- Land
Est. Annual Taxes
- $165
Map
Home Values in the Area
Average Home Value in this Area
Tax History
| Year | Tax Paid | Tax Assessment Tax Assessment Total Assessment is a certain percentage of the fair market value that is determined by local assessors to be the total taxable value of land and additions on the property. | Land | Improvement |
|---|---|---|---|---|
| 2024 | $165 | $9,100 | $9,100 | $0 |
| 2023 | $128 | $7,500 | $7,500 | $0 |
| 2022 | $104 | $5,900 | $5,900 | $0 |
| 2021 | $126 | $5,100 | $5,100 | $0 |
| 2020 | $120 | $5,100 | $5,100 | $0 |
| 2019 | $126 | $6,200 | $6,200 | $0 |
| 2018 | $157 | $6,400 | $6,400 | $0 |
| 2017 | $181 | $7,300 | $7,300 | $0 |
| 2016 | $126 | $7,800 | $7,800 | $0 |
| 2014 | $118 | $8,100 | $8,100 | $0 |
| 2013 | $118 | $7,000 | $7,000 | $0 |
Property History
| Date | Event | Price | List to Sale | Price per Sq Ft |
|---|---|---|---|---|
| 04/21/2025 04/21/25 | Price Changed | $105,000 | -8.7% | -- |
| 11/03/2024 11/03/24 | For Sale | $115,000 | -- | -- |
Purchase History
| Date | Type | Sale Price | Title Company |
|---|---|---|---|
| Warranty Deed | $35,000 | None Listed On Document | |
| Interfamily Deed Transfer | $38,727 | Metropolitan Title |
Mortgage History
| Date | Status | Loan Amount | Loan Type |
|---|---|---|---|
| Open | $33,712 | New Conventional |
- 615 S Harvey Dr
- 111 S Third St Unit 104
- 2410 M
- 116 S Walnut St Unit 116
- 223 E Second St Unit 3
- 5000 Prestwick Square
- 7145 S Meridian St
- 4224 S Washington St Unit 4224 1E
- 1028 N 10th St
- 1026 N 10th St
- 1024 N 10th St
- 1022 N 10th St
- 1020 N 10th St
- 1018 N 10th St
- 1016 N 10th St
- 1014 N 10th St
- 1027 N 9th St
- 1025 N 9th St
- 1023 N 9th St
- 1021 N 9th St