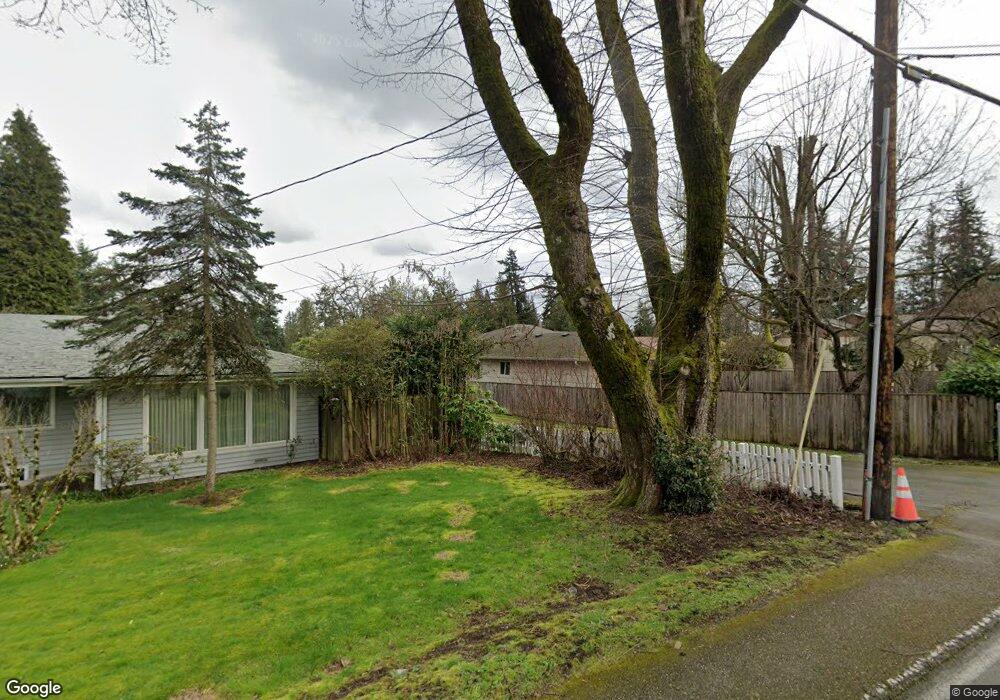
8011 Upper Ridge Rd Everett, WA 98203
Evergreen NeighborhoodEstimated Value: $559,096 - $630,000
2
Beds
1
Bath
882
Sq Ft
$665/Sq Ft
Est. Value
About This Home
This home is located at 8011 Upper Ridge Rd, Everett, WA 98203 and is currently estimated at $586,524, approximately $664 per square foot. 8011 Upper Ridge Rd is a home located in Snohomish County with nearby schools including Horizon Elementary School, Olympic View Middle School, and Mariner High School.
Ownership History
Date
Name
Owned For
Owner Type
Purchase Details
Closed on
May 19, 2000
Sold by
Schwitters Christopher L
Bought by
Brown Scott E
Current Estimated Value
Home Financials for this Owner
Home Financials are based on the most recent Mortgage that was taken out on this home.
Original Mortgage
$118,870
Outstanding Balance
$40,888
Interest Rate
8.08%
Estimated Equity
$545,636
Purchase Details
Closed on
May 22, 1996
Sold by
Blank Lyle E and Blank Karolyn
Bought by
Schwitters Christopher L
Home Financials for this Owner
Home Financials are based on the most recent Mortgage that was taken out on this home.
Original Mortgage
$117,331
Interest Rate
7.97%
Mortgage Type
FHA
Purchase Details
Closed on
Feb 13, 1996
Sold by
Sherman Clinton R and Sherman Judy Renai
Bought by
Blank Lyle E and Blank Karolyn
Home Financials for this Owner
Home Financials are based on the most recent Mortgage that was taken out on this home.
Original Mortgage
$99,950
Interest Rate
6.99%
Create a Home Valuation Report for This Property
The Home Valuation Report is an in-depth analysis detailing your home's value as well as a comparison with similar homes in the area
Home Values in the Area
Average Home Value in this Area
Purchase History
| Date | Buyer | Sale Price | Title Company |
|---|---|---|---|
| Brown Scott E | $139,850 | -- | |
| Schwitters Christopher L | $118,000 | Commonwealth Land Title | |
| Blank Lyle E | $124,950 | Commonwealth Land Title |
Source: Public Records
Mortgage History
| Date | Status | Borrower | Loan Amount |
|---|---|---|---|
| Open | Brown Scott E | $118,870 | |
| Previous Owner | Schwitters Christopher L | $117,331 | |
| Previous Owner | Blank Lyle E | $99,950 |
Source: Public Records
Tax History
| Year | Tax Paid | Tax Assessment Tax Assessment Total Assessment is a certain percentage of the fair market value that is determined by local assessors to be the total taxable value of land and additions on the property. | Land | Improvement |
|---|---|---|---|---|
| 2025 | $3,707 | $500,500 | $335,400 | $165,100 |
| 2024 | $3,707 | $466,700 | $305,200 | $161,500 |
| 2023 | $4,062 | $524,600 | $328,300 | $196,300 |
| 2022 | $3,558 | $397,700 | $229,400 | $168,300 |
| 2020 | $2,918 | $327,100 | $179,500 | $147,600 |
| 2019 | $2,720 | $308,100 | $162,800 | $145,300 |
| 2018 | $2,844 | $278,000 | $147,100 | $130,900 |
| 2017 | $2,482 | $247,400 | $126,100 | $121,300 |
| 2016 | $2,253 | $222,100 | $103,300 | $118,800 |
| 2015 | $2,088 | $186,200 | $89,300 | $96,900 |
| 2013 | $1,431 | $119,400 | $69,500 | $49,900 |
Source: Public Records
Map
Nearby Homes
- 7910 E Glen Dr
- 126 W Casino Rd Unit 5
- 9 76th St SE
- 501 75th Place SW
- 7525 Beverly Ln
- 323 75th St SE Unit A14
- 323 75th St SE Unit B10
- 8911 Holly Dr Unit 104
- 1001 W Casino Rd Unit C201
- 1001 W Casino Rd Unit A303
- 615 75th St SE Unit C53
- 615 75th St SE Unit C52
- 8823 Holly Dr Unit 502
- 8823 Holly Dr Unit C102
- 8823 Holly Dr Unit H206
- 8823 Holly Dr Unit H204
- 747 75th St SE Unit B203
- 226 93rd Place SW Unit 8
- 630 90th St SW Unit A/B
- 6916 Beverly Ln
- 8005 Upper Ridge Rd
- 8019 Upper Ridge Rd
- 8009 Upper Ridge Rd
- 201 80th Place SW
- 7931 Upper Ridge Rd
- 8002 Upper Ridge Rd
- 0 80th Place SW
- 8012 Meridian Ave
- 202 80th Place SW
- 8008 Meridian Ave
- 7925 Upper Ridge Rd
- 8008 Upper Ridge Rd
- 8006 Upper Ridge Rd
- 7930 Meridian Ave
- 208 80th Place SW
- 204 79th Place SW
- 102 81st St SW
- 114 81st St SW
- 3 81st St SW
- 32 81st St SW
Your Personal Tour Guide
Ask me questions while you tour the home.