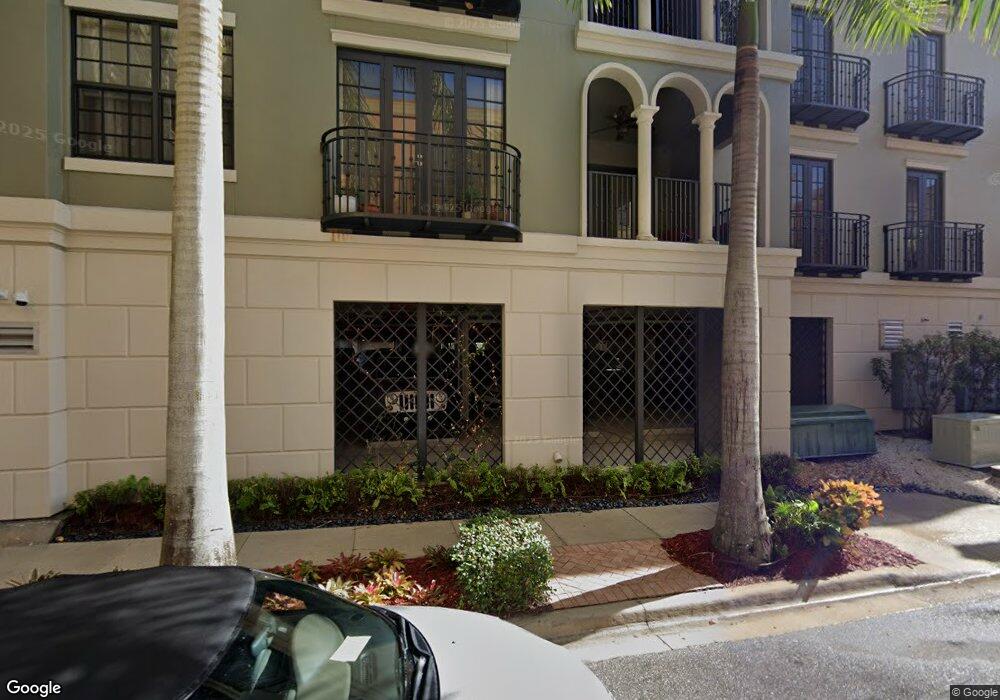
8011 Via Monte Carlo Way Unit 309 Estero, FL 33928
Coconut Point NeighborhoodEstimated Value: $392,209 - $450,000
2
Beds
2
Baths
1,480
Sq Ft
$286/Sq Ft
Est. Value
About This Home
This home is located at 8011 Via Monte Carlo Way Unit 309, Estero, FL 33928 and is currently estimated at $423,052, approximately $285 per square foot. 8011 Via Monte Carlo Way Unit 309 is a home located in Lee County with nearby schools including Spring Creek Elementary School, Three Oaks Elementary School, and Pinewoods Elementary School.
Ownership History
Date
Name
Owned For
Owner Type
Purchase Details
Closed on
Oct 27, 2021
Sold by
Bhat Urmila Shivaram
Bought by
Dawson Paul
Current Estimated Value
Home Financials for this Owner
Home Financials are based on the most recent Mortgage that was taken out on this home.
Original Mortgage
$280,500
Outstanding Balance
$255,536
Interest Rate
2.88%
Mortgage Type
New Conventional
Estimated Equity
$167,516
Purchase Details
Closed on
Jan 29, 2016
Sold by
Mtrr Llc
Bought by
Bhat Urmila Shivaram
Home Financials for this Owner
Home Financials are based on the most recent Mortgage that was taken out on this home.
Original Mortgage
$232,000
Interest Rate
3.98%
Mortgage Type
New Conventional
Purchase Details
Closed on
Sep 21, 2007
Sold by
The Residences At Coconut Point Llc
Bought by
Mtrr Llc
Create a Home Valuation Report for This Property
The Home Valuation Report is an in-depth analysis detailing your home's value as well as a comparison with similar homes in the area
Home Values in the Area
Average Home Value in this Area
Purchase History
| Date | Buyer | Sale Price | Title Company |
|---|---|---|---|
| Dawson Paul | $400,000 | Ross Title & Escrow | |
| Bhat Urmila Shivaram | $290,000 | Warranty Title Solutions Llc | |
| Mtrr Llc | $572,700 | First Title Of Sw Fl Inc |
Source: Public Records
Mortgage History
| Date | Status | Borrower | Loan Amount |
|---|---|---|---|
| Open | Dawson Paul | $280,500 | |
| Previous Owner | Bhat Urmila Shivaram | $232,000 |
Source: Public Records
Tax History Compared to Growth
Tax History
| Year | Tax Paid | Tax Assessment Tax Assessment Total Assessment is a certain percentage of the fair market value that is determined by local assessors to be the total taxable value of land and additions on the property. | Land | Improvement |
|---|---|---|---|---|
| 2025 | $5,033 | $339,635 | -- | $339,635 |
| 2024 | $5,033 | $376,213 | -- | -- |
| 2023 | $5,071 | $342,012 | $0 | $0 |
| 2022 | $4,119 | $310,920 | $0 | $310,920 |
| 2021 | $3,240 | $235,529 | $0 | $235,529 |
| 2020 | $3,233 | $228,523 | $0 | $228,523 |
| 2019 | $3,247 | $227,715 | $0 | $227,715 |
| 2018 | $3,241 | $222,870 | $0 | $222,870 |
| 2017 | $3,755 | $251,133 | $0 | $251,133 |
| 2016 | $3,523 | $230,430 | $0 | $230,430 |
| 2015 | $3,535 | $224,100 | $0 | $224,100 |
Source: Public Records
Map
Nearby Homes
- 8001 Via Monte Carlo Way Unit 1204
- 23159 Amgci Way Unit 3307
- 23159 Amgci Way Unit 302
- 23159 Amgci Way Unit 3109
- 23159 Amgci Way Unit 3217
- 23159 Amgci Way Unit 3205
- 23161 Fashion Dr Unit 7206
- 23191 Fashion Dr Unit 8101
- 23191 Fashion Dr Unit 8106
- 8010 Via Sardinia Way Unit 4303
- 8010 Via Sardinia Way Unit 203
- 8010 Via Sardinia Way Unit 4315
- 8010 Via Sardinia Way Unit 4204
- 8010 Via Sardinia Way Unit 209
- 23081 Rosedale Dr Unit 201
- 23136 Rosedale Dr Unit 102
- 23156 Rosedale Dr Unit 201
- 23151 Rosedale Dr Unit 101
- 22971 Rosedale Dr Unit 101
- 23166 Rosedale Dr Unit 201
- 8011 Via Monte Carlo Way Unit 104
- 8011 Via Monte Carlo Way Unit 2104
- 8011 Via Monty Carlo Way Way Unit 2204
- 8011 Via Monte Carlo Way Unit 116
- 8011 Via Monte Carlo Way Unit 2116
- 8011 Via Monte Carlo Way Unit 2207
- 8011 Via Monte Carlo Way Unit 115
- 8011 Via Monte Carlo Way Unit 2303
- 8011 Via Monte Carlo Way Unit 210
- 8011 Via Monte Carlo Way Unit 202
- 8011 Via Monte Carlo Way Unit 215
- 8011 Via Monte Carlo Way Unit 203
- 8011 Via Monte Carlo Way
- 8011 Via Monte Carlo Way Unit 313
- 8011 Via Monte Carlo Way Unit 102
- 8011 Via Monte Carlo Way Unit 307
- 8011 Via Monte Carlo Way Unit 2307
- 8011 Via Monte Carlo Way Unit 2105
- 8011 Via Monte Carlo Way Unit 2209
- 8011 Via Monte Carlo Way Unit 2204