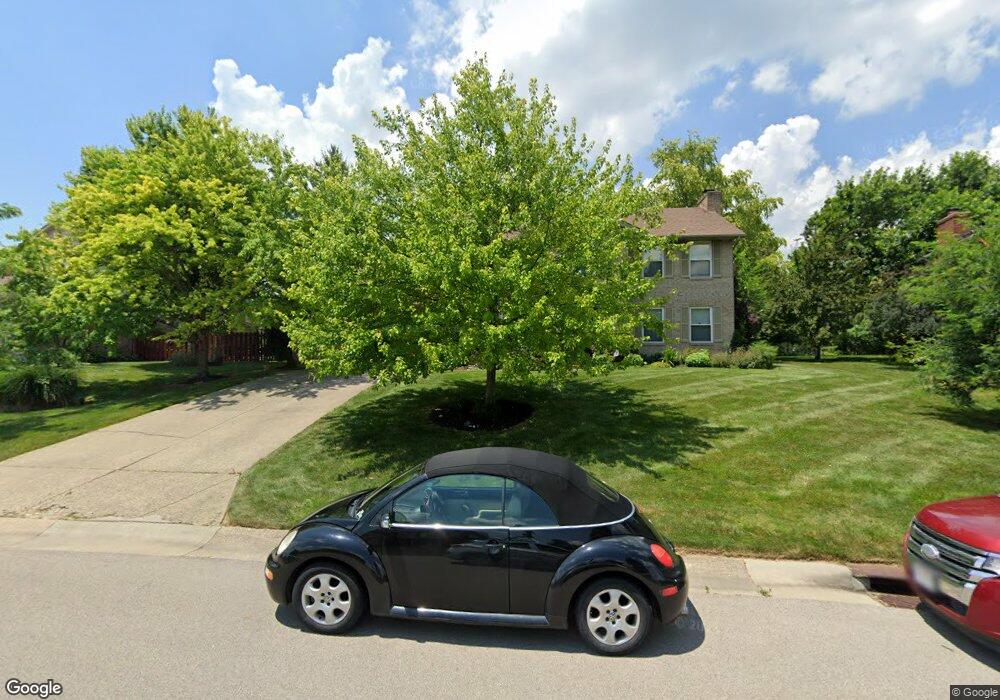
8011 W Gate Park West Chester, OH 45069
West Chester Township NeighborhoodEstimated Value: $434,000 - $508,000
4
Beds
3
Baths
2,444
Sq Ft
$190/Sq Ft
Est. Value
About This Home
This home is located at 8011 W Gate Park, West Chester, OH 45069 and is currently estimated at $465,023, approximately $190 per square foot. 8011 W Gate Park is a home located in Butler County with nearby schools including Hopewell Early Childhood School, Woodland Elementary School, and Hopewell Junior School.
Ownership History
Date
Name
Owned For
Owner Type
Purchase Details
Closed on
May 22, 2007
Sold by
Feller Theresa M and Feller Timothy R
Bought by
Feller Timothy R and Feller Theresa M
Current Estimated Value
Home Financials for this Owner
Home Financials are based on the most recent Mortgage that was taken out on this home.
Original Mortgage
$157,000
Outstanding Balance
$96,897
Interest Rate
6.44%
Mortgage Type
Stand Alone Refi Refinance Of Original Loan
Estimated Equity
$368,126
Purchase Details
Closed on
Jan 26, 2006
Sold by
Hogden Theresa M
Bought by
Hogden Theresa M and Weber Elizabeth A
Purchase Details
Closed on
Jan 23, 2006
Sold by
Hogden Jeff M
Bought by
Hogden Theresa M
Purchase Details
Closed on
Feb 25, 1999
Sold by
Reed Douglas and Reed Paula
Bought by
Hogden Jeff M and Hogden Theresa M
Home Financials for this Owner
Home Financials are based on the most recent Mortgage that was taken out on this home.
Original Mortgage
$142,600
Interest Rate
6.92%
Mortgage Type
Purchase Money Mortgage
Create a Home Valuation Report for This Property
The Home Valuation Report is an in-depth analysis detailing your home's value as well as a comparison with similar homes in the area
Home Values in the Area
Average Home Value in this Area
Purchase History
| Date | Buyer | Sale Price | Title Company |
|---|---|---|---|
| Feller Timothy R | -- | First American Title Ins | |
| Hogden Theresa M | -- | None Available | |
| Hogden Theresa M | -- | None Available | |
| Hogden Jeff M | $178,250 | -- |
Source: Public Records
Mortgage History
| Date | Status | Borrower | Loan Amount |
|---|---|---|---|
| Open | Feller Timothy R | $157,000 | |
| Previous Owner | Hogden Jeff M | $142,600 |
Source: Public Records
Tax History Compared to Growth
Tax History
| Year | Tax Paid | Tax Assessment Tax Assessment Total Assessment is a certain percentage of the fair market value that is determined by local assessors to be the total taxable value of land and additions on the property. | Land | Improvement |
|---|---|---|---|---|
| 2024 | $5,205 | $126,120 | $16,100 | $110,020 |
| 2023 | $5,169 | $122,970 | $16,100 | $106,870 |
| 2022 | $5,313 | $91,810 | $16,100 | $75,710 |
| 2021 | $4,652 | $88,200 | $16,100 | $72,100 |
| 2020 | $4,763 | $88,200 | $16,100 | $72,100 |
| 2019 | $7,274 | $75,910 | $15,660 | $60,250 |
| 2018 | $4,300 | $75,910 | $15,660 | $60,250 |
| 2017 | $4,363 | $75,910 | $15,660 | $60,250 |
| 2016 | $4,274 | $69,810 | $15,660 | $54,150 |
| 2015 | $4,267 | $69,810 | $15,660 | $54,150 |
| 2014 | $4,096 | $69,810 | $15,660 | $54,150 |
| 2013 | $4,096 | $65,120 | $15,660 | $49,460 |
Source: Public Records
Map
Nearby Homes
- 7986 Tylers Way
- 6955 Grand Oaks Ct
- 921 Leslie Ct
- 873 Tradewind Dr
- 947 Olympia Dr
- 8430 Meadowlark Ct
- 8166 Shadybrook Dr
- 8500 Crestmont Dr
- 6070 Fireside Dr Unit 45
- 6729 Maverick Dr
- 7506 Parliament Ct Unit 149
- 7541 Granby Way Unit 89
- 7531 Exchequer Ct
- 8558 Cox Rd
- 6357 Coverage Ct
- 6383 Coverage Ct
- 6407 Coverage Ct
- 6375 Coverage Ct
- 6365 Coverage Ct
- 6361 Coverage Ct
- 8021 W Gate Park
- 8007 W Gate Park
- 8016 Pepper Pike
- 8008 Pepper Pike
- 8024 Pepper Pike
- 2927 W Gate Park
- 8001 W Gate Park
- 8014 W Gate Park
- 8004 W Gate Park
- 7996 Pepper Pike
- 8041 W Gate Park
- 8026 W Gate Park
- 7982 Pepper Pike
- 7994 W Gate Park
- 8036 W Gate Park
- 8038 Pepper Pike
- 7993 W Gate Park
- 7964 Pepper Pike
- 8049 W Gate Park
- 8044 W Gate Park