8012 17th Ave Kenosha, WI 53143
Sunnyside NeighborhoodEstimated Value: $236,404 - $304,000
3
Beds
1
Bath
1,188
Sq Ft
$220/Sq Ft
Est. Value
About This Home
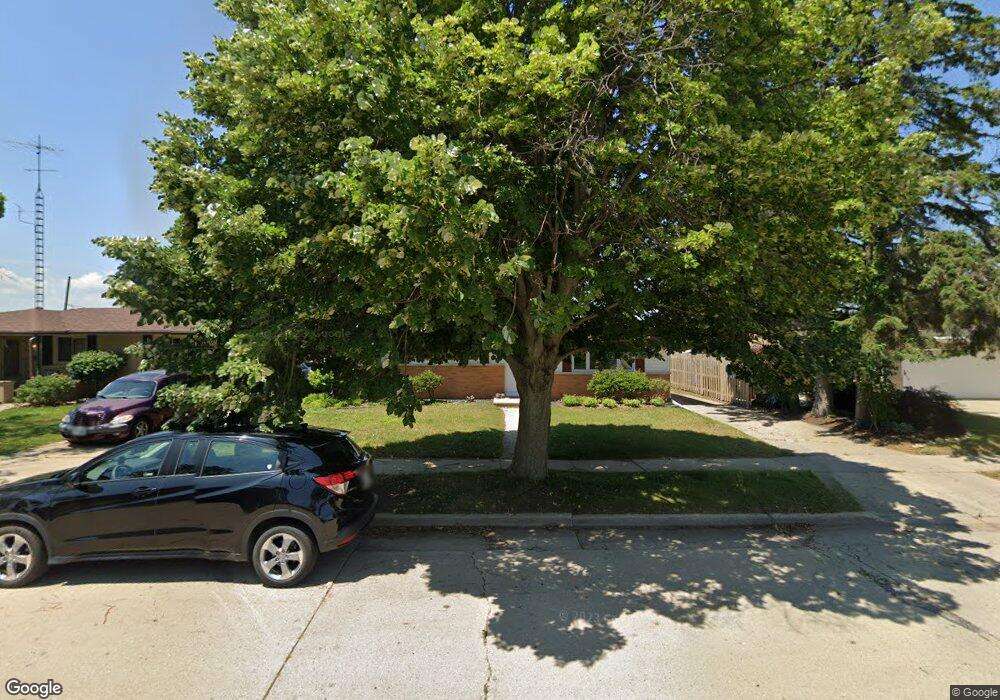
This home is located at 8012 17th Ave, Kenosha, WI 53143 and is currently estimated at $261,851, approximately $220 per square foot. 8012 17th Ave is a home located in Kenosha County with nearby schools including Vernon Elementary School, Lincoln Middle School, and Tremper High School.
Ownership History
Date
Name
Owned For
Owner Type
Purchase Details
Closed on
Jul 26, 2018
Sold by
Schutz Sharon E and Neisler Rhonda
Bought by
Abbott Daniel T and Abbott Michelle M
Current Estimated Value
Home Financials for this Owner
Home Financials are based on the most recent Mortgage that was taken out on this home.
Original Mortgage
$137,365
Outstanding Balance
$120,958
Interest Rate
5.62%
Mortgage Type
FHA
Estimated Equity
$140,893
Create a Home Valuation Report for This Property
The Home Valuation Report is an in-depth analysis detailing your home's value as well as a comparison with similar homes in the area
Home Values in the Area
Average Home Value in this Area
Purchase History
| Date | Buyer | Sale Price | Title Company |
|---|---|---|---|
| Abbott Daniel T | $139,900 | None Available |
Source: Public Records
Mortgage History
| Date | Status | Borrower | Loan Amount |
|---|---|---|---|
| Open | Abbott Daniel T | $137,365 |
Source: Public Records
Tax History
| Year | Tax Paid | Tax Assessment Tax Assessment Total Assessment is a certain percentage of the fair market value that is determined by local assessors to be the total taxable value of land and additions on the property. | Land | Improvement |
|---|---|---|---|---|
| 2025 | $2,970 | $186,200 | $53,100 | $133,100 |
| 2024 | $2,929 | $127,400 | $36,000 | $91,400 |
| 2023 | $2,929 | $127,400 | $36,000 | $91,400 |
| 2022 | $2,972 | $127,400 | $36,000 | $91,400 |
| 2021 | $3,046 | $127,400 | $36,000 | $91,400 |
| 2020 | $3,158 | $127,400 | $36,000 | $91,400 |
| 2019 | $3,032 | $127,400 | $36,000 | $91,400 |
| 2018 | $2,983 | $112,800 | $36,000 | $76,800 |
| 2017 | $2,922 | $112,800 | $36,000 | $76,800 |
| 2016 | $2,854 | $112,800 | $36,000 | $76,800 |
| 2015 | $2,945 | $111,500 | $36,000 | $75,500 |
| 2014 | $2,921 | $111,500 | $36,000 | $75,500 |
Source: Public Records
Map
Nearby Homes
- 0 Confidential - Unit 1932390
- 7921 18th Ave
- 8204 15th Ave
- 7923 Sheridan Rd
- 1902 84th St
- 7721 14th Ave
- 8421 17th Ave
- 7616 15th Ave
- 8415 14th Ave
- 807 82nd St Unit 14
- 1703 84th Place
- 807 79th St
- 7822 8th Ave
- 2008 85th St
- 7547 22nd Ave
- 2575 Lincoln Rd
- 7511 22nd Ave
- 2304 85th St
- 8521 Sheridan Rd
- 7413 15th Ave
Your Personal Tour Guide
Ask me questions while you tour the home.