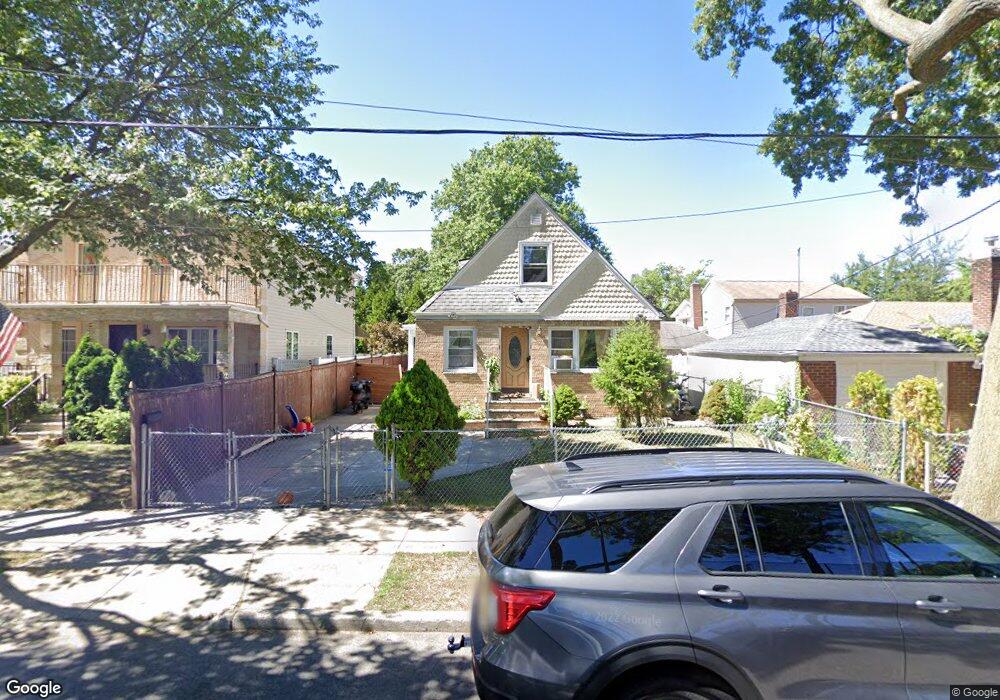
8014 261st St Glen Oaks, NY 11004
Estimated Value: $794,031 - $940,000
--
Bed
--
Bath
1,060
Sq Ft
$810/Sq Ft
Est. Value
About This Home
This home is located at 8014 261st St, Glen Oaks, NY 11004 and is currently estimated at $858,508, approximately $809 per square foot. 8014 261st St is a home located in Queens County with nearby schools including P.S.115Q James J Ambrose School, Irwin Altman Middle School 172, and Martin Van Buren High School.
Ownership History
Date
Name
Owned For
Owner Type
Purchase Details
Closed on
Dec 17, 2010
Sold by
Gressey Janet and Gressey Stephen
Bought by
Makalandra Lucian
Current Estimated Value
Home Financials for this Owner
Home Financials are based on the most recent Mortgage that was taken out on this home.
Original Mortgage
$388,000
Outstanding Balance
$258,294
Interest Rate
4.37%
Mortgage Type
Purchase Money Mortgage
Estimated Equity
$600,214
Purchase Details
Closed on
Aug 19, 2002
Sold by
Prema Michael Edward and Lakeram Prema Pranita D
Bought by
Camus Sergion E and Camus Janin G
Home Financials for this Owner
Home Financials are based on the most recent Mortgage that was taken out on this home.
Original Mortgage
$300,000
Interest Rate
6.2%
Purchase Details
Closed on
Mar 21, 2000
Sold by
Sundack Henry and Sundack Anne
Bought by
Prema Michael Edward and Prema Pranita Devi Lakeram
Home Financials for this Owner
Home Financials are based on the most recent Mortgage that was taken out on this home.
Original Mortgage
$160,000
Interest Rate
8.26%
Create a Home Valuation Report for This Property
The Home Valuation Report is an in-depth analysis detailing your home's value as well as a comparison with similar homes in the area
Home Values in the Area
Average Home Value in this Area
Purchase History
| Date | Buyer | Sale Price | Title Company |
|---|---|---|---|
| Makalandra Lucian | $485,000 | -- | |
| Camus Sergion E | -- | -- | |
| Prema Michael Edward | $231,000 | -- |
Source: Public Records
Mortgage History
| Date | Status | Borrower | Loan Amount |
|---|---|---|---|
| Open | Makalandra Lucian | $388,000 | |
| Previous Owner | Camus Sergion E | $300,000 | |
| Previous Owner | Prema Michael Edward | $160,000 |
Source: Public Records
Tax History Compared to Growth
Tax History
| Year | Tax Paid | Tax Assessment Tax Assessment Total Assessment is a certain percentage of the fair market value that is determined by local assessors to be the total taxable value of land and additions on the property. | Land | Improvement |
|---|---|---|---|---|
| 2025 | $8,563 | $43,474 | $14,605 | $28,869 |
| 2024 | $8,563 | $42,633 | $13,460 | $29,173 |
| 2023 | $8,078 | $40,220 | $13,968 | $26,252 |
| 2022 | $7,575 | $41,580 | $15,420 | $26,160 |
| 2021 | $7,624 | $38,760 | $15,420 | $23,340 |
| 2020 | $7,668 | $37,260 | $15,420 | $21,840 |
| 2019 | $7,432 | $38,880 | $15,420 | $23,460 |
| 2018 | $6,832 | $33,517 | $14,356 | $19,161 |
| 2017 | $6,446 | $31,620 | $15,420 | $16,200 |
| 2016 | $6,035 | $31,620 | $15,420 | $16,200 |
| 2015 | $3,641 | $30,190 | $16,971 | $13,219 |
| 2014 | $3,641 | $29,959 | $16,841 | $13,118 |
Source: Public Records
Map
Nearby Homes
- 80-18 261st St
- 8049 260th St
- 80-37 259th St
- 80-43 263rd St
- 8133 260th St
- 80-27 257th St
- 81-31 259th St
- 81-56 264th St
- 80-64 266th St
- 81-25 265th St
- 8019 266th St
- 78-07 264th St
- 81-46 266th St
- 8112 255th St
- 255-31 75th Ave Unit 2nd Floor
- 82-44 263rd St
- 254-04 75th Ave Unit G-2
- 255-9 75th Ave Unit lower
- 74-12 260th St Unit H-2
- 258-15 83rd Ave