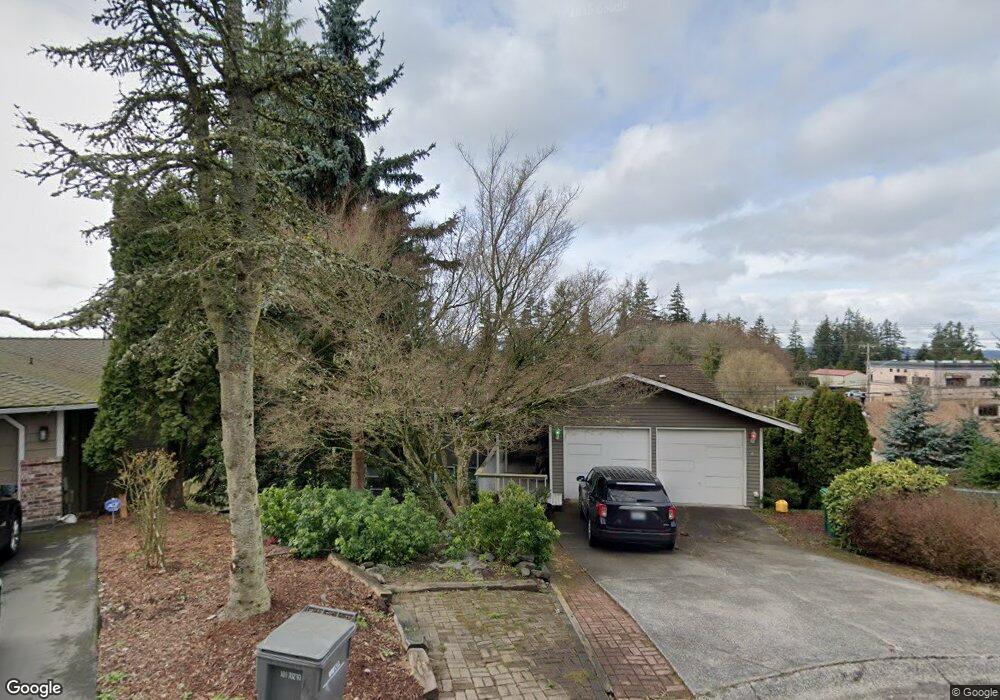
8014 48th Place W Mukilteo, WA 98275
Estimated Value: $852,388 - $914,000
5
Beds
3
Baths
1,466
Sq Ft
$598/Sq Ft
Est. Value
About This Home
This home is located at 8014 48th Place W, Mukilteo, WA 98275 and is currently estimated at $876,347, approximately $597 per square foot. 8014 48th Place W is a home located in Snohomish County with nearby schools including Mukilteo Elementary School, Olympic View Middle School, and Kamiak High School.
Ownership History
Date
Name
Owned For
Owner Type
Purchase Details
Closed on
Aug 7, 2020
Sold by
Oliver Richard L and Oliver Doris
Bought by
Boyle Christopher R
Current Estimated Value
Home Financials for this Owner
Home Financials are based on the most recent Mortgage that was taken out on this home.
Original Mortgage
$559,000
Outstanding Balance
$501,229
Interest Rate
3.6%
Mortgage Type
New Conventional
Estimated Equity
$375,118
Purchase Details
Closed on
Jan 17, 2007
Sold by
St John Laura L
Bought by
Oliver Richard L and Oliver Doris A
Home Financials for this Owner
Home Financials are based on the most recent Mortgage that was taken out on this home.
Original Mortgage
$351,960
Interest Rate
8.37%
Mortgage Type
Negative Amortization
Purchase Details
Closed on
Apr 19, 2002
Sold by
Taylor William F
Bought by
Taylor Laura L
Create a Home Valuation Report for This Property
The Home Valuation Report is an in-depth analysis detailing your home's value as well as a comparison with similar homes in the area
Home Values in the Area
Average Home Value in this Area
Purchase History
| Date | Buyer | Sale Price | Title Company |
|---|---|---|---|
| Boyle Christopher R | $559,000 | Chicago Title | |
| Oliver Richard L | $439,950 | Stewart | |
| Taylor Laura L | -- | Chicago Title Insurance Co |
Source: Public Records
Mortgage History
| Date | Status | Borrower | Loan Amount |
|---|---|---|---|
| Open | Boyle Christopher R | $559,000 | |
| Previous Owner | Oliver Richard L | $351,960 |
Source: Public Records
Tax History Compared to Growth
Tax History
| Year | Tax Paid | Tax Assessment Tax Assessment Total Assessment is a certain percentage of the fair market value that is determined by local assessors to be the total taxable value of land and additions on the property. | Land | Improvement |
|---|---|---|---|---|
| 2025 | $5,504 | $778,500 | $442,100 | $336,400 |
| 2024 | $5,504 | $739,600 | $408,800 | $330,800 |
| 2023 | $5,567 | $771,900 | $392,100 | $379,800 |
| 2022 | $4,930 | $586,400 | $261,600 | $324,800 |
| 2020 | $4,337 | $517,900 | $238,100 | $279,800 |
| 2019 | $4,040 | $492,400 | $214,600 | $277,800 |
| 2018 | $4,374 | $463,400 | $213,800 | $249,600 |
| 2017 | $3,980 | $436,600 | $205,200 | $231,400 |
| 2016 | $3,556 | $387,300 | $199,200 | $188,100 |
| 2015 | $3,572 | $350,400 | $161,500 | $188,900 |
| 2013 | $3,026 | $279,100 | $120,700 | $158,400 |
Source: Public Records
Map
Nearby Homes
- 8211 Mukilteo Speedway
- 8010 Mukilteo Speedway Unit 105
- 8010 Mukilteo Speedway Unit 110
- 4803 84th St SW
- 7926 46th Ave W
- 8221 53rd Ave W Unit G28
- 8221 53rd Ave W Unit F55
- 5029 84th St SW Unit 301
- 5029 84th St SW Unit 109
- 5321 80th Place SW
- 7920 53rd Ave W Unit D
- 4632 74th St SW
- 8833 47th Place W
- 8851 48th Place W
- 8116 Naketa Beach Walk
- 1902 Clover Place
- 9124 44th Ave W
- 1803 19th Dr
- 5700 Sunset Ln
- 0 Lot1300 61st Place W
- 8018 48th Place W
- 8018 48th Place W Unit Lower
- 4824 80th St SW
- 8023 48th Place W
- 8013 48th Place W
- 4815 81st Place SW
- 8004 Mukilteo Speedway
- 4831 81st Place SW
- 7924 49th Place W
- 7925 49th Place W
- 4809 81st Place SW
- 4731 81st Place SW
- 8016 47th Place W
- 8020 47th Place W
- 8103 Mukilteo Speedway
- 4915 81st Place SW
- 4809 80th St SW
- 8008 47th Place W
- 7928 Mukilteo Speedway