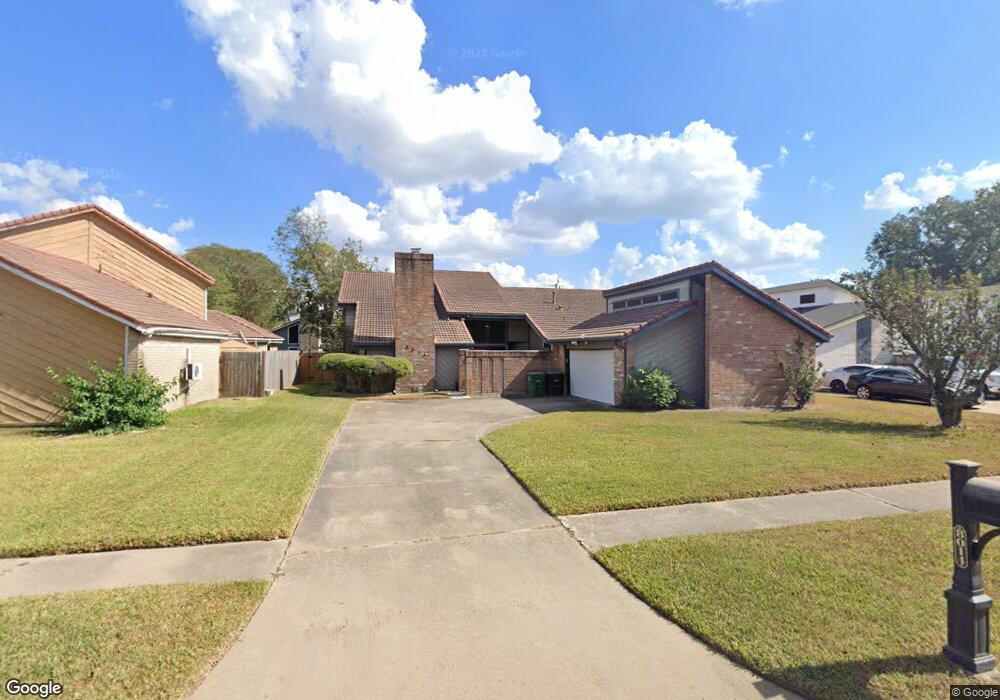
8014 Green Lawn Dr Houston, TX 77088
Greater Inwood NeighborhoodEstimated Value: $299,000 - $314,000
4
Beds
3
Baths
2,992
Sq Ft
$102/Sq Ft
Est. Value
About This Home
This home is located at 8014 Green Lawn Dr, Houston, TX 77088 and is currently estimated at $305,261, approximately $102 per square foot. 8014 Green Lawn Dr is a home located in Harris County with nearby schools including Edward a Vines EC/Pre-K/K School, J. Ruth Smith Elementary, and Hoffman Middle School.
Ownership History
Date
Name
Owned For
Owner Type
Purchase Details
Closed on
Mar 21, 2013
Sold by
Dealbonne Vernie Lee and Dealbonne Jerry L
Bought by
Banks Tanya L and Banks Dwyane K
Current Estimated Value
Home Financials for this Owner
Home Financials are based on the most recent Mortgage that was taken out on this home.
Original Mortgage
$112,891
Outstanding Balance
$80,418
Interest Rate
3.75%
Mortgage Type
FHA
Estimated Equity
$224,843
Purchase Details
Closed on
Oct 5, 2001
Sold by
Carter Eddie M
Bought by
Dearbonne Jerry L and Dearbonne Vernie Lee
Home Financials for this Owner
Home Financials are based on the most recent Mortgage that was taken out on this home.
Original Mortgage
$119,032
Interest Rate
6.84%
Mortgage Type
FHA
Purchase Details
Closed on
Oct 2, 1992
Sold by
Carter Dawson L and Carter Eddie M
Bought by
Carter Dawson L and Carter Eddie M
Create a Home Valuation Report for This Property
The Home Valuation Report is an in-depth analysis detailing your home's value as well as a comparison with similar homes in the area
Home Values in the Area
Average Home Value in this Area
Purchase History
| Date | Buyer | Sale Price | Title Company |
|---|---|---|---|
| Banks Tanya L | -- | American Title Company | |
| Dearbonne Jerry L | -- | Chicago Title Insurance Co | |
| Carter Dawson L | -- | Chicago Title |
Source: Public Records
Mortgage History
| Date | Status | Borrower | Loan Amount |
|---|---|---|---|
| Open | Banks Tanya L | $112,891 | |
| Previous Owner | Dearbonne Jerry L | $119,032 |
Source: Public Records
Tax History Compared to Growth
Tax History
| Year | Tax Paid | Tax Assessment Tax Assessment Total Assessment is a certain percentage of the fair market value that is determined by local assessors to be the total taxable value of land and additions on the property. | Land | Improvement |
|---|---|---|---|---|
| 2025 | $4,870 | $276,695 | $49,329 | $227,366 |
| 2024 | $4,870 | $292,727 | $49,329 | $243,398 |
| 2023 | $4,870 | $292,727 | $49,329 | $243,398 |
| 2022 | $5,750 | $239,730 | $41,108 | $198,622 |
| 2021 | $5,857 | $233,187 | $41,108 | $192,079 |
| 2020 | $5,746 | $222,725 | $41,108 | $181,617 |
| 2019 | $5,476 | $200,069 | $21,924 | $178,145 |
| 2018 | $2,224 | $179,901 | $21,924 | $157,977 |
| 2017 | $4,649 | $179,901 | $21,924 | $157,977 |
| 2016 | $4,227 | $168,325 | $21,924 | $146,401 |
| 2015 | $2,972 | $164,179 | $21,924 | $142,255 |
| 2014 | $2,972 | $131,675 | $21,924 | $109,751 |
Source: Public Records
Map
Nearby Homes
- 6011 Green Falls Dr
- 7868 Green Lawn Dr Unit 7868
- 5935 Caruso Forest Dr
- 7840 Bateman Ln Unit 7840
- 6023 Elkwood Forest Dr
- 7750 Green Lawn Dr
- 0 Antoine Dr
- 5942 Caruso Forest Dr
- 7736 Challie Ln
- 6114 Elkwood Forest Dr
- 6303 Greenway Forest Ln
- 7727 Green Lawn Dr
- 7728 Challie Ln
- 32 Regency Ln
- 6122 Gallant Forest Dr
- 5638 Hickory Forest Dr
- 7402 Alabonson Rd Unit 506
- 7402 Alabonson Rd Unit 309
- 7402 Alabonson Rd Unit 510
- 7402 Alabonson Rd Unit 108
- 8018 Green Lawn Dr
- 8010 Green Lawn Dr
- 8007 Wray Ct
- 8011 Wray Ct
- 8022 Green Lawn Dr
- 8015 Wray Ct
- 5930 Green Falls Dr
- 5934 Green Falls Dr
- 8011 Green Lawn Dr
- 8102 Green Lawn Dr
- 8019 Green Lawn Dr
- 5926 Green Falls Dr
- 8019 Wray Ct
- 8007 Green Lawn Dr
- 6002 Green Falls Dr
- 8106 Green Lawn Dr
- 8059 Zimmermann Dr
- 8010 Wray Ct
- 8023 Wray Ct
- 8030 Zimmermann Dr