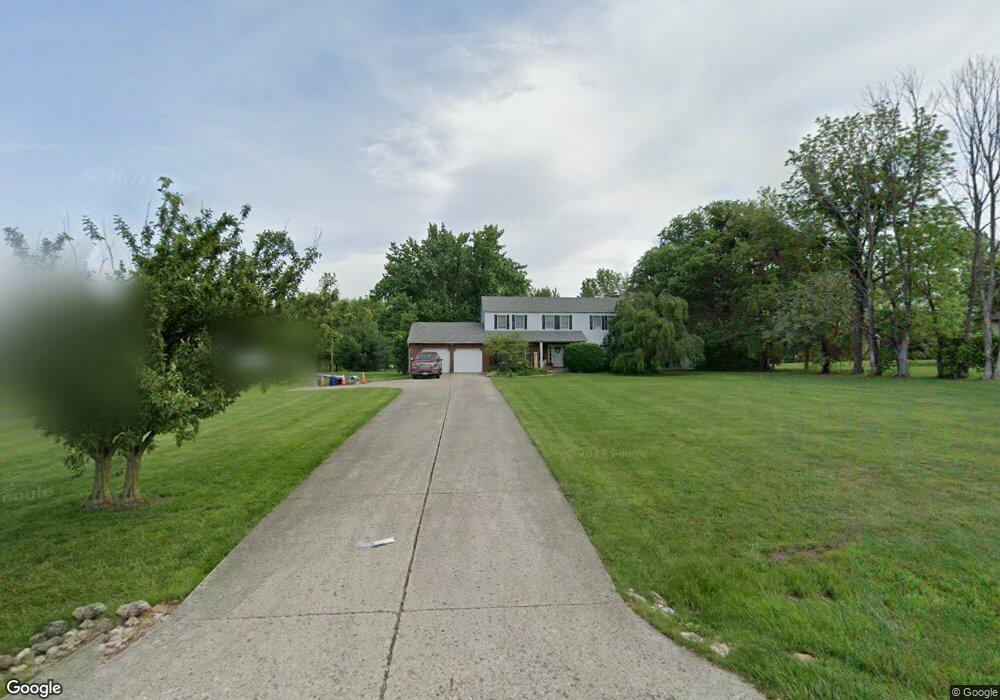
8014 W Ohio State Ln NW Lancaster, OH 43130
Bloom NeighborhoodEstimated Value: $431,871 - $534,000
5
Beds
3
Baths
2,388
Sq Ft
$196/Sq Ft
Est. Value
About This Home
This home is located at 8014 W Ohio State Ln NW, Lancaster, OH 43130 and is currently estimated at $467,718, approximately $195 per square foot. 8014 W Ohio State Ln NW is a home located in Fairfield County with nearby schools including Bloom Carroll Primary School, Bloom Carroll Intermediate School, and Bloom-Carroll Middle School.
Ownership History
Date
Name
Owned For
Owner Type
Purchase Details
Closed on
Jun 28, 2005
Sold by
Bailey Dean and Bailey Denise
Bought by
Garris Joseph N and Garris Lori L
Current Estimated Value
Home Financials for this Owner
Home Financials are based on the most recent Mortgage that was taken out on this home.
Original Mortgage
$208,227
Outstanding Balance
$109,328
Interest Rate
5.75%
Mortgage Type
FHA
Estimated Equity
$358,390
Purchase Details
Closed on
Sep 7, 2001
Sold by
Ramsey Samuel L
Bought by
Bailey Dean and Bailey Denise
Home Financials for this Owner
Home Financials are based on the most recent Mortgage that was taken out on this home.
Original Mortgage
$172,800
Interest Rate
7.03%
Mortgage Type
New Conventional
Create a Home Valuation Report for This Property
The Home Valuation Report is an in-depth analysis detailing your home's value as well as a comparison with similar homes in the area
Home Values in the Area
Average Home Value in this Area
Purchase History
| Date | Buyer | Sale Price | Title Company |
|---|---|---|---|
| Garris Joseph N | $209,900 | -- | |
| Bailey Dean | $204,000 | -- |
Source: Public Records
Mortgage History
| Date | Status | Borrower | Loan Amount |
|---|---|---|---|
| Open | Garris Joseph N | $208,227 | |
| Closed | Bailey Dean | $172,800 |
Source: Public Records
Tax History Compared to Growth
Tax History
| Year | Tax Paid | Tax Assessment Tax Assessment Total Assessment is a certain percentage of the fair market value that is determined by local assessors to be the total taxable value of land and additions on the property. | Land | Improvement |
|---|---|---|---|---|
| 2024 | $8,598 | $104,350 | $17,200 | $87,150 |
| 2023 | $4,417 | $104,350 | $17,200 | $87,150 |
| 2022 | $4,451 | $104,350 | $17,200 | $87,150 |
| 2021 | $3,965 | $84,010 | $15,210 | $68,800 |
| 2020 | $4,007 | $84,010 | $15,210 | $68,800 |
| 2019 | $4,020 | $84,010 | $15,210 | $68,800 |
| 2018 | $3,313 | $55,460 | $11,250 | $44,210 |
| 2017 | $3,122 | $70,050 | $11,250 | $58,800 |
| 2016 | $3,075 | $70,050 | $11,250 | $58,800 |
| 2015 | $2,922 | $64,730 | $11,250 | $53,480 |
| 2014 | $2,804 | $64,730 | $11,250 | $53,480 |
| 2013 | $2,804 | $64,730 | $11,250 | $53,480 |
Source: Public Records
Map
Nearby Homes
- 7835 E Ohio State Ln NW
- 8642 Water St
- 839 Rockmill Rd NW
- 9605 Royalton Rd SW
- 7985 Lithopolis Rd NW
- 1975 Lamb Rd NW
- 10 Mount Zion Rd NW
- 681 Mount Zion Rd SW
- 8416 Royalton Rd SW
- 8245 Royalton Rd SW
- 8143 Royalton Rd SW
- 8485 Westfall Rd SW
- 1219 W Slate Ridge Dr
- 2780 Cedar Hill Rd NW
- 5550 Westfall Rd SW
- 10385 Lithopolis Rd NW
- 8322 Benson Rd
- 11394 Cedar Creek Dr NW
- 00 Duncan Rd SW
- 4180 Stone Hill Drive East NW
- 8045 W Ohio State Ln NW
- 8042 W Ohio State Ln NW
- 7968 E Ohio State Ln NW
- 7975 Otterbein Trail NW
- 8070 W Ohio State Ln NW
- 8015 W Ohio State Ln NW
- 8053 Otterbein Trail NW
- 8043 W Ohio State Ln NW
- 7940 E Ohio State Ln NW
- 7975 E Ohio State Ln NW
- 8098 W Ohio State Ln NW
- 7931 Otterbein Trail NW
- 7906 E Ohio State Ln NW
- 7945 E Ohio State Ln NW
- 8099 W Ohio State Ln NW
- 7968 Otterbein Trail NW
- 8126 W Ohio State Ln NW
- 8109 Otterbein Trail NW
- 7878 E Ohio State Ln NW
- 7917 E Ohio State Ln NW