
Seller's Agent in 2013
Linda Seyller
RE/MAX
(708) 214-5285
4 in this area
74 Total Sales

Estimated Value: $274,000 - $340,000
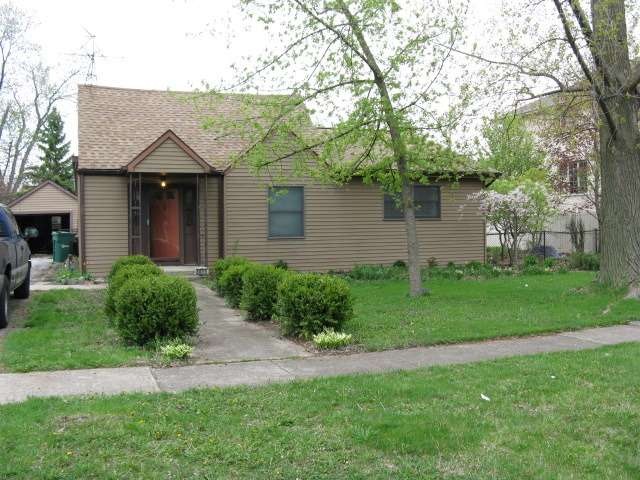
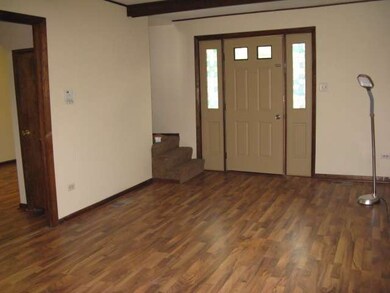
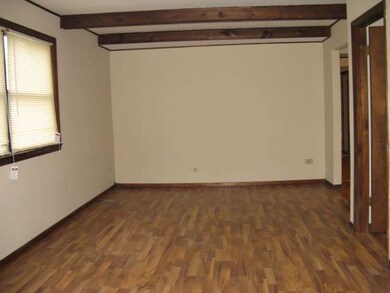
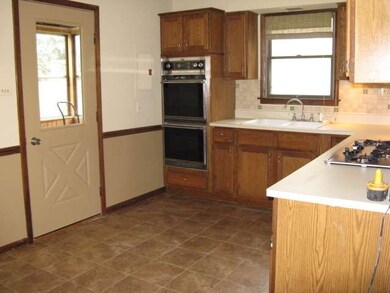
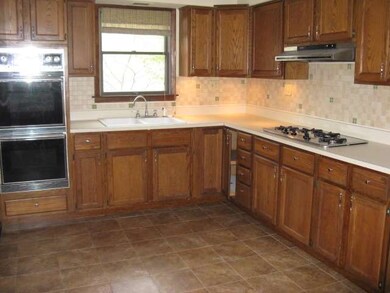
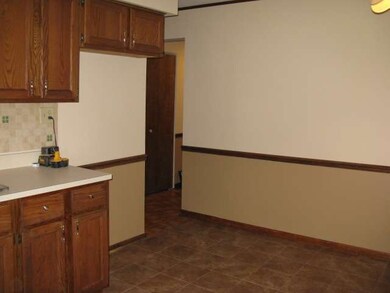
Stop in to see this clean, spacious 3 bedroom Cape Cod home. Freshly painted. Newer roof and windows. Good sized kitchen w/ plenty of preparation space. Family room. Nice laundry area. Loads of closets. Enclosed porch/ 3 season room off the kitchen offers additional room to gather. Over sized lot, fenced yard and side drive.
We collect this data history from publicly available records. To have your information removed, we recommend requesting removal directly through your county’s website.
We collect this data history from publicly available records. To have your information removed, we recommend requesting removal directly through your county’s website.
| Date | Buyer | Sale Price | Title Company |
|---|---|---|---|
| $129,000 | None Available |
We collect this data history from publicly available records. To have your information removed, we recommend requesting removal directly through your county’s website.
| Date | Status | Borrower | Loan Amount |
|---|---|---|---|
| Open | $126,663 |
We collect this data history from publicly available records. To have your information removed, we recommend requesting removal directly through your county’s website.
| Date | Event | Price | List to Sale | Price per Sq Ft |
|---|---|---|---|---|
| 07/19/2013 07/19/13 | Sold | $129,000 | -4.4% | $99 / Sq Ft |
| 06/17/2013 06/17/13 | Pending | -- | -- | -- |
| 05/06/2013 05/06/13 | For Sale | $134,900 | -- | $104 / Sq Ft |
We collect this data history from publicly available records. To have your information removed, we recommend requesting removal directly through your county’s website.
| Year | Tax Paid | Tax Assessment Tax Assessment Total Assessment is a certain percentage of the fair market value that is determined by local assessors to be the total taxable value of land and additions on the property. | Land | Improvement |
|---|---|---|---|---|
| 2025 | $4,667 | $16,996 | $8,496 | $8,500 |
| 2024 | $4,667 | $16,996 | $8,496 | $8,500 |
| 2023 | $3,851 | $18,355 | $9,855 | $8,500 |
| 2022 | $3,851 | $13,409 | $8,559 | $4,850 |
| 2021 | $3,718 | $13,407 | $8,558 | $4,849 |
| 2020 | $3,668 | $13,407 | $8,558 | $4,849 |
| 2019 | $3,236 | $12,461 | $7,780 | $4,681 |
| 2018 | $3,142 | $12,461 | $7,780 | $4,681 |
| 2017 | $3,058 | $12,461 | $7,780 | $4,681 |
| 2016 | $3,441 | $12,262 | $6,483 | $5,779 |
| 2015 | $3,270 | $12,262 | $6,483 | $5,779 |
| 2014 | $4,035 | $12,262 | $6,483 | $5,779 |
| 2013 | $3,220 | $13,343 | $6,483 | $6,860 |
Seller's Agent in 2013
Linda Seyller
RE/MAX
(708) 214-5285
4 in this area
74 Total Sales
Buyer's Agent in 2013
Mark Santoyo
RE/MAX
(312) 625-0007
2 in this area
208 Total Sales
Source: Midwest Real Estate Data (MRED)
MLS Number: MRD08334708
APN: 19-33-107-014-0000
Disclaimer: Certain information contained herein is derived from information provided by parties other than Homes.com. All information provided is deemed reliable, but is not guaranteed to be accurate and should be independently verified.
![]() All data is obtained from various sources and may not have been verified by broker or MLS GRID. Supplied Open House Information is subject to change without notice. All information should be independently reviewed and verified for accuracy. Properties may or may not be listed by the office/agent presenting the information. Some IDX listings have been excluded from this website.
All data is obtained from various sources and may not have been verified by broker or MLS GRID. Supplied Open House Information is subject to change without notice. All information should be independently reviewed and verified for accuracy. Properties may or may not be listed by the office/agent presenting the information. Some IDX listings have been excluded from this website.
Listings courtesy of Midwest Real Estate Data (MRED) as distributed by MLS GRID.
Based on information submitted to the MLS GRID
Ask me questions while you tour the home.