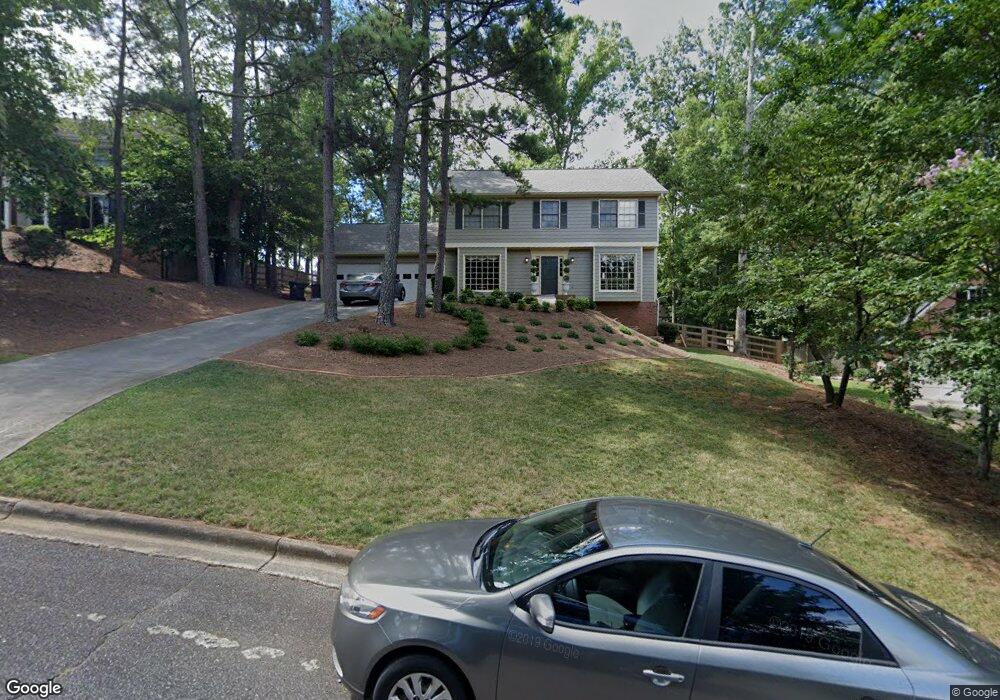
8015 Meadowsweet Trace Unit 2 Roswell, GA 30076
Estimated Value: $561,437 - $631,000
4
Beds
3
Baths
2,242
Sq Ft
$265/Sq Ft
Est. Value
About This Home
This home is located at 8015 Meadowsweet Trace Unit 2, Roswell, GA 30076 and is currently estimated at $593,109, approximately $264 per square foot. 8015 Meadowsweet Trace Unit 2 is a home located in Fulton County with nearby schools including River Eves Elementary School, Holcomb Bridge Middle School, and Centennial High School.
Ownership History
Date
Name
Owned For
Owner Type
Purchase Details
Closed on
Jan 23, 2019
Sold by
Waxman Jill Levey
Bought by
Waxman Adam and Waxman Adam
Current Estimated Value
Home Financials for this Owner
Home Financials are based on the most recent Mortgage that was taken out on this home.
Original Mortgage
$243,600
Outstanding Balance
$213,737
Interest Rate
4.5%
Mortgage Type
New Conventional
Estimated Equity
$379,372
Purchase Details
Closed on
Mar 29, 2002
Sold by
Hromey John F and Hromey Mary L
Bought by
Levey Jill S
Home Financials for this Owner
Home Financials are based on the most recent Mortgage that was taken out on this home.
Original Mortgage
$176,300
Interest Rate
7.12%
Mortgage Type
New Conventional
Create a Home Valuation Report for This Property
The Home Valuation Report is an in-depth analysis detailing your home's value as well as a comparison with similar homes in the area
Home Values in the Area
Average Home Value in this Area
Purchase History
| Date | Buyer | Sale Price | Title Company |
|---|---|---|---|
| Waxman Adam | -- | -- | |
| Levey Jill S | $220,400 | -- |
Source: Public Records
Mortgage History
| Date | Status | Borrower | Loan Amount |
|---|---|---|---|
| Open | Waxman Adam | $243,600 | |
| Previous Owner | Levey Jill S | $176,300 |
Source: Public Records
Tax History Compared to Growth
Tax History
| Year | Tax Paid | Tax Assessment Tax Assessment Total Assessment is a certain percentage of the fair market value that is determined by local assessors to be the total taxable value of land and additions on the property. | Land | Improvement |
|---|---|---|---|---|
| 2025 | $730 | $191,640 | $38,080 | $153,560 |
| 2023 | $5,020 | $177,840 | $51,880 | $125,960 |
| 2022 | $3,141 | $160,200 | $31,560 | $128,640 |
| 2021 | $3,726 | $137,160 | $26,600 | $110,560 |
| 2020 | $3,778 | $135,520 | $26,280 | $109,240 |
| 2019 | $443 | $125,280 | $25,040 | $100,240 |
| 2018 | $2,720 | $122,320 | $24,440 | $97,880 |
| 2017 | $2,451 | $84,000 | $16,800 | $67,200 |
| 2016 | $2,451 | $84,000 | $16,800 | $67,200 |
| 2015 | $2,920 | $84,000 | $16,800 | $67,200 |
| 2014 | $2,575 | $84,000 | $16,800 | $67,200 |
Source: Public Records
Map
Nearby Homes
- 9156 Branch Valley Way
- 140 Glen Holly Dr
- 1985 Branch Valley Dr
- 680 Branch Valley Ct
- 1820 Branch Valley Dr
- 3209 Canyon Point Cir
- 1115 Canyon Point Cir
- 3001 Canyon Point Cir
- 110 River Terrace Point
- 4040 Declaration Dr
- 920 Renaissance Way
- 109 W Ridge Way
- 3010 Kara Ct
- 3020 Kara Ct
- 420 Little Pines Ct
- 3040 Gray Hawk Ln
- 145 W Ridge Way
- 230 Winterberry Ct
- 315 Sea Holly Cir
- 225 Winterberry Ct
- 8025 Meadowsweet Trace
- 8005 Meadowsweet Trace
- 1930 Glen Eves Dr
- 1940 Glen Eves Dr
- 1920 Glen Eves Dr
- 1950 Glen Eves Dr
- 8035 Meadowsweet Trace Unit 2
- 8010 Meadowsweet Trace
- 1960 Glen Eves Dr
- 7195 Meadowsweet Trace
- 8020 Meadowsweet Trace
- 1910 Glen Eves Dr
- 9158 Branch Valley Way
- 8030 Meadowsweet Trace
- 8045 Meadowsweet Trace Unit 2
- 9160 Branch Valley Way
- 9163 Meadowsweet Trace
- 7985 Meadowsweet Trace
- 7185 Meadowsweet Trace
- 1900 Glen Eves Dr