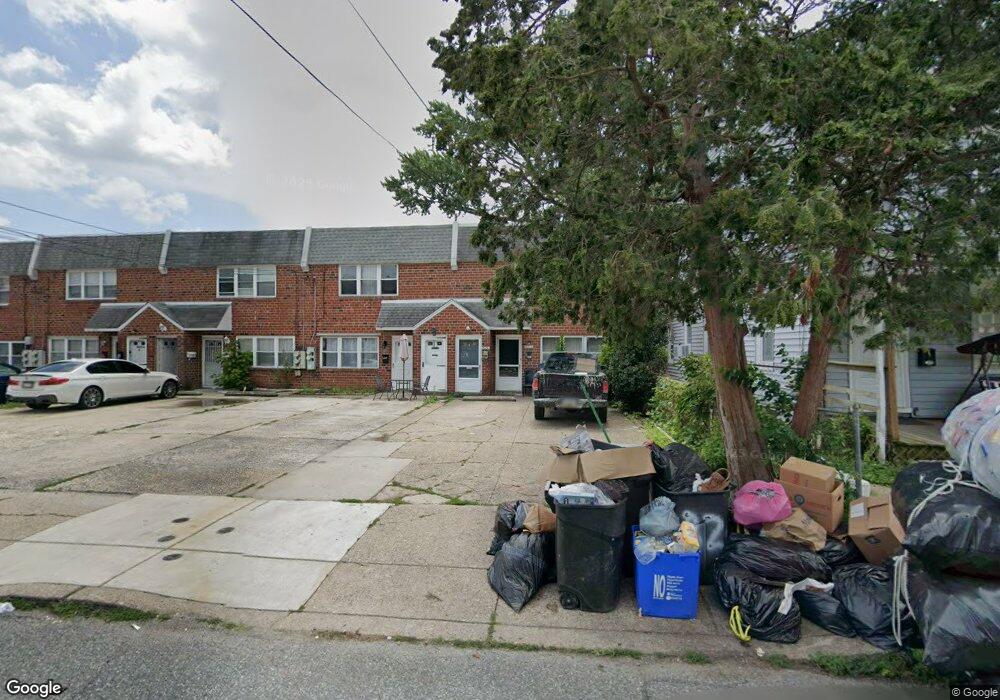
8015 Moro St Unit B Philadelphia, PA 19136
Holmesburg NeighborhoodEstimated Value: $331,000 - $422,001
--
Bed
--
Bath
2,000
Sq Ft
$185/Sq Ft
Est. Value
About This Home
This home is located at 8015 Moro St Unit B, Philadelphia, PA 19136 and is currently estimated at $370,667, approximately $185 per square foot. 8015 Moro St Unit B is a home located in Philadelphia County with nearby schools including Lincoln High School, Joseph H. Brown School, and Meehan Austin Middle School.
Ownership History
Date
Name
Owned For
Owner Type
Purchase Details
Closed on
Jan 3, 2019
Sold by
Ferguson Mattehw J
Bought by
Wu Fa Shun
Current Estimated Value
Home Financials for this Owner
Home Financials are based on the most recent Mortgage that was taken out on this home.
Original Mortgage
$208,000
Outstanding Balance
$131,390
Interest Rate
4.8%
Mortgage Type
Commercial
Estimated Equity
$239,277
Purchase Details
Closed on
Dec 12, 2012
Sold by
Guterman Joseph and Guterman Raisa
Bought by
Ferguson Matthew J
Home Financials for this Owner
Home Financials are based on the most recent Mortgage that was taken out on this home.
Original Mortgage
$184,318
Interest Rate
3.38%
Mortgage Type
Commercial
Purchase Details
Closed on
Jun 15, 2012
Sold by
Riley Richard and Estate Of Andrew S Mastalski
Bought by
Guterman Joseph and Guterman Raisa
Create a Home Valuation Report for This Property
The Home Valuation Report is an in-depth analysis detailing your home's value as well as a comparison with similar homes in the area
Home Values in the Area
Average Home Value in this Area
Purchase History
| Date | Buyer | Sale Price | Title Company |
|---|---|---|---|
| Wu Fa Shun | $260,000 | First City Abstract Agency I | |
| Ferguson Matthew J | $179,999 | None Available | |
| Guterman Joseph | $989,000 | None Available |
Source: Public Records
Mortgage History
| Date | Status | Borrower | Loan Amount |
|---|---|---|---|
| Open | Wu Fa Shun | $208,000 | |
| Previous Owner | Ferguson Matthew J | $184,318 |
Source: Public Records
Tax History Compared to Growth
Tax History
| Year | Tax Paid | Tax Assessment Tax Assessment Total Assessment is a certain percentage of the fair market value that is determined by local assessors to be the total taxable value of land and additions on the property. | Land | Improvement |
|---|---|---|---|---|
| 2026 | $4,143 | $360,600 | $72,120 | $288,480 |
| 2025 | $4,143 | $360,600 | $72,120 | $288,480 |
| 2024 | $4,143 | $360,600 | $72,120 | $288,480 |
| 2023 | $4,143 | $296,000 | $59,200 | $236,800 |
| 2022 | $2,552 | $296,000 | $59,200 | $236,800 |
| 2021 | $2,552 | $0 | $0 | $0 |
| 2020 | $2,552 | $0 | $0 | $0 |
| 2019 | $2,389 | $0 | $0 | $0 |
| 2018 | $2,255 | $0 | $0 | $0 |
| 2017 | $2,255 | $0 | $0 | $0 |
| 2016 | $2,255 | $0 | $0 | $0 |
| 2015 | $2,159 | $0 | $0 | $0 |
| 2014 | -- | $161,100 | $33,188 | $127,912 |
| 2012 | -- | $21,664 | $1,987 | $19,677 |
Source: Public Records
Map
Nearby Homes
- 3438 Decatur St
- 8011 Crispin St
- 3526 Welsh Rd
- 4016 Decatur St
- 8056 Erdrick St
- 4128 Welsh Rd
- 8072 Erdrick St
- 4228 Rhawn St
- 4203 Hartel Ave
- 3414 Hartel Ave
- 4243 Frost St
- 4246 Rhawn St
- 3556 Meridian St
- 8088 Fairview St
- 4228 Hartel Ave
- 4314 Rhawn St
- 3427 Arthur St
- 3405 Sheffield St
- 3216 Stanwood St
- 4224 Chippendale Ave
- 8015 UNIT A Moro St
- 8015 Moro St
- 8015 Moro St Unit A
- 8015 Moro St Unit B 1FL
- 8015 Moro St Unit B 2 FL
- 8013 Moro St
- 8011 Moro St
- 8017 Moro St Unit A
- 8017 Moro St
- 8009 Moro St
- 8019 Moro St
- 8016 Craig St
- 8018 Craig St
- 8020 Craig St
- 8021 Moro St
- 8022 Craig St
- 8012 Craig St
- 8023 Moro St
- 8024 Craig St
- 3537 Rhawn St