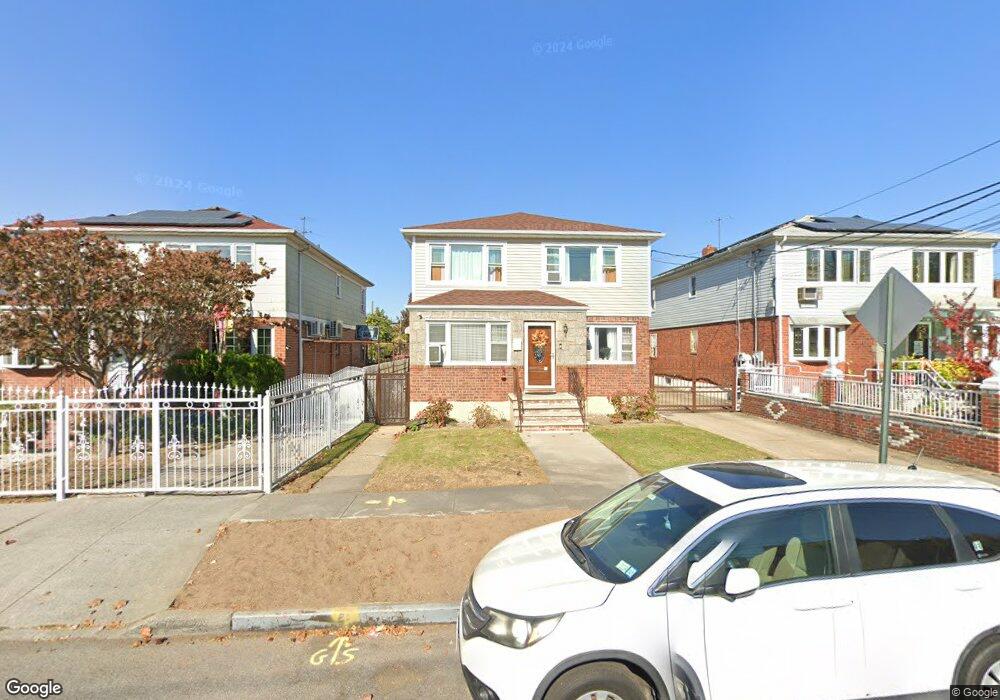
8015 Sutter Ave Unit 2 Ozone Park, NY 11417
Ozone Park NeighborhoodEstimated Value: $1,156,000 - $1,215,000
2
Beds
1
Bath
2,456
Sq Ft
$483/Sq Ft
Est. Value
About This Home
This home is located at 8015 Sutter Ave Unit 2, Ozone Park, NY 11417 and is currently estimated at $1,185,500, approximately $482 per square foot. 8015 Sutter Ave Unit 2 is a home located in Queens County with nearby schools including P.S. 63 - Old South, Robert H. Goddard High School, and Our World Neighborhood Charter School 2.
Ownership History
Date
Name
Owned For
Owner Type
Purchase Details
Closed on
Mar 12, 2020
Sold by
Algarin Stephanie and Cortorreal Anmeroli
Bought by
Cortorreal Anmeroli and Pena Joseph
Current Estimated Value
Home Financials for this Owner
Home Financials are based on the most recent Mortgage that was taken out on this home.
Original Mortgage
$28,320
Interest Rate
3.6%
Mortgage Type
New Conventional
Purchase Details
Closed on
Feb 13, 2018
Sold by
Lombardi Mary Jo
Bought by
Algarin Stephanie and Cortorreal Anmeroli
Home Financials for this Owner
Home Financials are based on the most recent Mortgage that was taken out on this home.
Original Mortgage
$579,313
Interest Rate
3.99%
Mortgage Type
New Conventional
Purchase Details
Closed on
Nov 17, 2000
Sold by
Scuderi Mary and Cassetta John J
Bought by
Lombardi Mary Jo
Create a Home Valuation Report for This Property
The Home Valuation Report is an in-depth analysis detailing your home's value as well as a comparison with similar homes in the area
Home Values in the Area
Average Home Value in this Area
Purchase History
| Date | Buyer | Sale Price | Title Company |
|---|---|---|---|
| Cortorreal Anmeroli | -- | -- | |
| Cortorreal Anmeroli | -- | -- | |
| Cortorreal Anmeroli | -- | -- | |
| Algarin Stephanie | $590,000 | -- | |
| Algarin Stephanie | $590,000 | -- | |
| Algarin Stephanie | $590,000 | -- | |
| Lombardi Mary Jo | -- | -- | |
| Lombardi Mary Jo | -- | -- |
Source: Public Records
Mortgage History
| Date | Status | Borrower | Loan Amount |
|---|---|---|---|
| Previous Owner | Cortorreal Anmeroli | $28,320 | |
| Previous Owner | Algarin Stephanie | $579,313 |
Source: Public Records
Tax History
| Year | Tax Paid | Tax Assessment Tax Assessment Total Assessment is a certain percentage of the fair market value that is determined by local assessors to be the total taxable value of land and additions on the property. | Land | Improvement |
|---|---|---|---|---|
| 2025 | $10,395 | $54,859 | $15,325 | $39,534 |
| 2024 | $10,395 | $51,756 | $14,672 | $37,084 |
| 2023 | $10,152 | $50,544 | $15,752 | $34,792 |
| 2022 | $9,702 | $61,860 | $20,700 | $41,160 |
| 2021 | $9,537 | $59,280 | $20,700 | $38,580 |
| 2020 | $7,368 | $55,800 | $20,700 | $35,100 |
| 2019 | $9,022 | $53,580 | $20,700 | $32,880 |
| 2018 | $8,586 | $42,120 | $15,812 | $26,308 |
| 2017 | $8,116 | $39,812 | $20,500 | $19,312 |
| 2016 | $7,959 | $39,812 | $20,500 | $19,312 |
| 2015 | $4,530 | $38,097 | $20,904 | $17,193 |
| 2014 | $4,530 | $35,942 | $22,203 | $13,739 |
Source: Public Records
Map
Nearby Homes
- 132-30 80th St
- 132-12 82nd St
- 13236 82nd St
- 107-53 77th St
- 132-36 84th St
- 133-24 78th St
- 7917 Glenmore Ave
- 84-11 Sutter Ave
- 7602 Blake Ave
- 13225 Ruby St
- 84-09 107th Ave
- 133- 38 Amber St
- 84-28 108th Ave
- 8509 Sutter Ave
- 8514 Sutter Ave
- 8133 Liberty Ave
- 105-21 84th St
- 10724 87th St
- 133-28 86th St
- 365 Forbell St
- 8015 Sutter Ave
- 8015 Sutter Ave Unit 2nd FL
- 8011 Sutter Ave
- 8019 Sutter Ave
- 10726 81st St
- 107-26 81st St
- 8007 Sutter Ave
- 107-24 81st St Unit 1st Fl
- 107-24 81st St
- 10724 81st St
- 107-18 81st St
- 10722 81st St
- 10737 80th St
- 8003 Sutter Ave
- 10735 80th St
- 107-20 81st St
- 10720 81st St
- 13202 81st St
- 10733 80th St