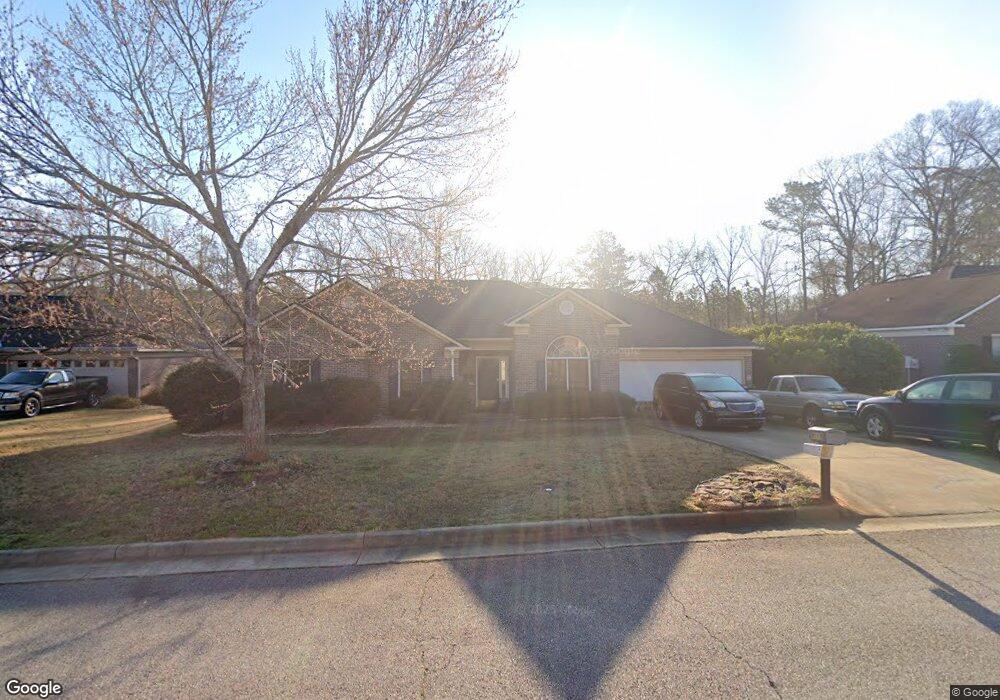
8018 Waterview Ct Midland, GA 31820
Northern Columbus NeighborhoodEstimated Value: $332,000 - $360,000
4
Beds
4
Baths
2,301
Sq Ft
$149/Sq Ft
Est. Value
About This Home
This home is located at 8018 Waterview Ct, Midland, GA 31820 and is currently estimated at $342,828, approximately $148 per square foot. 8018 Waterview Ct is a home located in Muscogee County with nearby schools including Eagle Ridge Academy, Blackmon Road Middle School, and Shaw High School.
Create a Home Valuation Report for This Property
The Home Valuation Report is an in-depth analysis detailing your home's value as well as a comparison with similar homes in the area
Home Values in the Area
Average Home Value in this Area
Tax History Compared to Growth
Tax History
| Year | Tax Paid | Tax Assessment Tax Assessment Total Assessment is a certain percentage of the fair market value that is determined by local assessors to be the total taxable value of land and additions on the property. | Land | Improvement |
|---|---|---|---|---|
| 2025 | $2,236 | $126,972 | $18,728 | $108,244 |
| 2024 | $2,235 | $126,972 | $18,728 | $108,244 |
| 2023 | $1,554 | $126,972 | $18,728 | $108,244 |
| 2022 | $2,330 | $91,520 | $18,728 | $72,792 |
| 2021 | $2,324 | $87,544 | $18,728 | $68,816 |
| 2020 | $2,324 | $87,544 | $18,728 | $68,816 |
| 2019 | $2,333 | $87,544 | $18,728 | $68,816 |
| 2018 | $2,333 | $87,544 | $18,728 | $68,816 |
| 2017 | $2,343 | $87,544 | $18,728 | $68,816 |
| 2016 | $2,352 | $70,299 | $14,000 | $56,299 |
| 2015 | $2,098 | $70,299 | $14,000 | $56,299 |
| 2014 | $2,103 | $70,299 | $14,000 | $56,299 |
| 2013 | -- | $70,299 | $14,000 | $56,299 |
Source: Public Records
Map
Nearby Homes
- 8848 Promenade Place
- 4848 Spring Ridge Dr
- 4840 Spring Ridge Dr
- 4854 Champions Way
- 7933 Prestwick Ct
- 7847 Kolven Cove
- 4880 Turnberry Ln
- 7807 Kolven Cove
- 7168 Pinewood Ct
- 8507 Galena Rd
- 4677 Ivy Patch Dr
- 4701 Turnberry Ln Unit 6
- 5110 Midland Trace
- 5905 Linley Ct
- 5135 Midland Trace
- 8039 Adelaide Dr
- 4756 Timarron Loop
- 7901 Ivy Park Dr
- 9410 Forest Crown Dr
- 9397 Forest Crown Dr
- 8012 Waterview Ct
- 8024 Waterview Ct
- 8006 Waterview Ct
- 8019 Waterview Ct
- 8013 Waterview Ct
- 8025 Waterview Ct
- 8000 Waterview Ct
- 8007 Waterview Ct
- 8029 Waterview Ct
- 5013 Waterview Dr
- 5036 Waterview Dr
- 8012 Waterstone Dr
- 8014 Waterstone Dr
- 8010 Waterstone Dr
- 8016 Waterstone Dr
- 5007 Waterview Dr
- 3022 Waterhill Dr
- 8018 Waterstone Dr
- 0 Waterstone Dr Unit 8870673
- 0 Waterstone Dr Unit 8310144