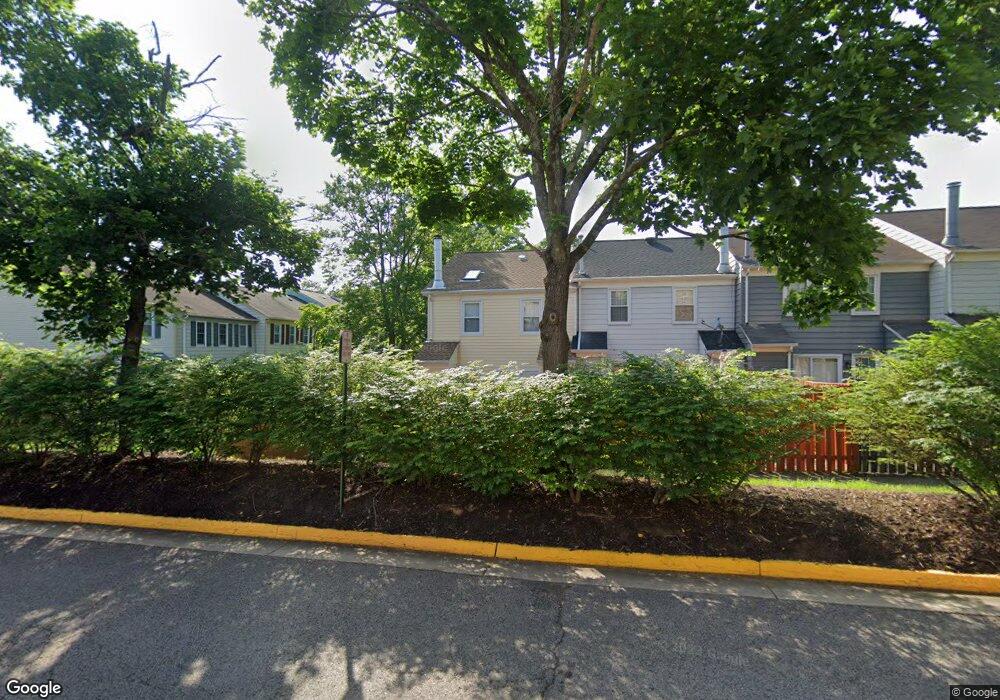
8019 Dayspring Ct Springfield, VA 22153
Estimated Value: $485,490 - $513,000
2
Beds
2
Baths
1,327
Sq Ft
$375/Sq Ft
Est. Value
About This Home
This home is located at 8019 Dayspring Ct, Springfield, VA 22153 and is currently estimated at $497,873, approximately $375 per square foot. 8019 Dayspring Ct is a home located in Fairfax County with nearby schools including Saratoga Elementary School, Key Middle, and Lewis High School.
Ownership History
Date
Name
Owned For
Owner Type
Purchase Details
Closed on
Nov 24, 2010
Sold by
Short Nikolas A and Rainey Diane M
Bought by
Holder Anner N
Current Estimated Value
Home Financials for this Owner
Home Financials are based on the most recent Mortgage that was taken out on this home.
Original Mortgage
$238,789
Outstanding Balance
$157,389
Interest Rate
4.25%
Mortgage Type
FHA
Estimated Equity
$340,484
Purchase Details
Closed on
Mar 21, 2005
Sold by
Huff Yvette L
Bought by
Short Nikolas A and Rainey Diane M
Home Financials for this Owner
Home Financials are based on the most recent Mortgage that was taken out on this home.
Original Mortgage
$311,000
Interest Rate
5.64%
Mortgage Type
New Conventional
Purchase Details
Closed on
Feb 15, 1999
Sold by
Pope Melvin
Bought by
Wood Yvette L
Home Financials for this Owner
Home Financials are based on the most recent Mortgage that was taken out on this home.
Original Mortgage
$112,390
Interest Rate
6.78%
Create a Home Valuation Report for This Property
The Home Valuation Report is an in-depth analysis detailing your home's value as well as a comparison with similar homes in the area
Home Values in the Area
Average Home Value in this Area
Purchase History
| Date | Buyer | Sale Price | Title Company |
|---|---|---|---|
| Holder Anner N | $245,000 | -- | |
| Short Nikolas A | $311,000 | -- | |
| Wood Yvette L | $113,000 | -- |
Source: Public Records
Mortgage History
| Date | Status | Borrower | Loan Amount |
|---|---|---|---|
| Open | Holder Anner N | $238,789 | |
| Previous Owner | Short Nikolas A | $311,000 | |
| Previous Owner | Wood Yvette L | $112,390 |
Source: Public Records
Tax History
| Year | Tax Paid | Tax Assessment Tax Assessment Total Assessment is a certain percentage of the fair market value that is determined by local assessors to be the total taxable value of land and additions on the property. | Land | Improvement |
|---|---|---|---|---|
| 2025 | $4,765 | $489,980 | $180,000 | $309,980 |
| 2024 | $4,765 | $411,350 | $150,000 | $261,350 |
| 2023 | $4,454 | $394,680 | $140,000 | $254,680 |
| 2022 | $4,437 | $388,060 | $140,000 | $248,060 |
| 2021 | $4,456 | $379,750 | $135,000 | $244,750 |
| 2020 | $3,999 | $337,870 | $120,000 | $217,870 |
| 2019 | $3,728 | $315,010 | $105,000 | $210,010 |
| 2018 | $3,507 | $304,930 | $97,000 | $207,930 |
| 2017 | $3,252 | $280,100 | $87,000 | $193,100 |
| 2016 | $3,354 | $289,550 | $87,000 | $202,550 |
Source: Public Records
Map
Nearby Homes
- 7937 Edinburgh Dr
- 7897 Carbondale Way
- 7918 Edinburgh Dr
- 8109 Overton Ct
- 7923 Lake Pleasant Dr
- 8010 Rockwood Ct
- 8306 Cushing Ct
- 7910 Richfield Rd
- 7920 Journey Ln
- 7630 Chancellor Way
- 8020 Pohick Rd
- 7594 Woodstown Dr
- 7994 Hidden Bridge Dr
- 8309 Terra Grande Ave
- 8228 Maple Ridge Ave
- 7690 Oak Field Ct
- 7596 Ruxton Dr
- 8404 Chillum Ct
- 8461 Rushing Creek Ct
- 8411 Chillum Ct
- 8017 Dayspring Ct
- 8015 Dayspring Ct
- 8013 Dayspring Ct
- 8023 Dayspring Ct
- 8021 Dayspring Ct
- 8025 Dayspring Ct
- 8011 Dayspring Ct
- 8027 Dayspring Ct
- 8009 Dayspring Ct
- 8028 Dayspring Ct
- 8026 Dayspring Ct
- 8007 Dayspring Ct
- 8024 Dayspring Ct
- 8005 Dayspring Ct
- 8018 Dayspring Ct
- 8016 Dayspring Ct
- 8022 Dayspring Ct
- 8014 Dayspring Ct
- 8012 Dayspring Ct
- 8047 Felecity Ct
Your Personal Tour Guide
Ask me questions while you tour the home.