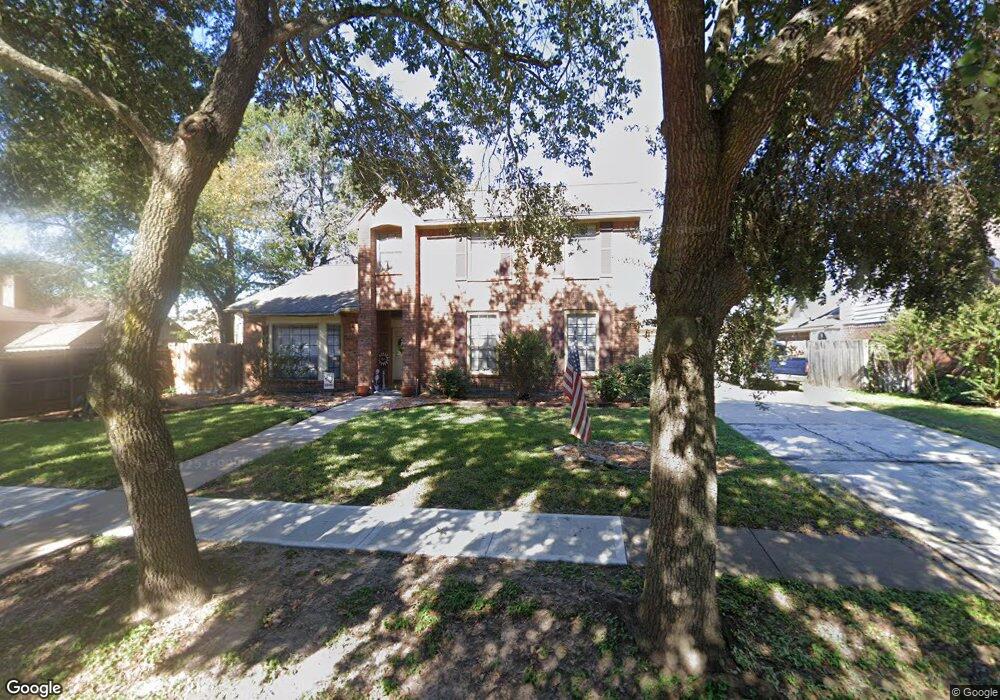
8019 Pine Falls Dr Houston, TX 77095
Copperfield NeighborhoodEstimated Value: $278,000 - $310,016
3
Beds
3
Baths
2,251
Sq Ft
$130/Sq Ft
Est. Value
About This Home
This home is located at 8019 Pine Falls Dr, Houston, TX 77095 and is currently estimated at $292,254, approximately $129 per square foot. 8019 Pine Falls Dr is a home located in Harris County with nearby schools including Fiest Elementary School, Labay Middle School, and Cypress Falls High School.
Ownership History
Date
Name
Owned For
Owner Type
Purchase Details
Closed on
Oct 19, 2015
Sold by
Owen Yassin S and Barron Kelly
Bought by
Owen Yassin S and Barron Kelly L
Current Estimated Value
Home Financials for this Owner
Home Financials are based on the most recent Mortgage that was taken out on this home.
Original Mortgage
$152,000
Outstanding Balance
$118,479
Interest Rate
3.93%
Mortgage Type
New Conventional
Estimated Equity
$173,775
Purchase Details
Closed on
May 24, 2011
Sold by
Blanchard Doug M and Kathleen Blanchard M
Bought by
Owen Yassin S
Home Financials for this Owner
Home Financials are based on the most recent Mortgage that was taken out on this home.
Original Mortgage
$151,070
Interest Rate
4.75%
Mortgage Type
FHA
Purchase Details
Closed on
Aug 8, 1995
Sold by
Schalliol Dennis E and Schalliol Mary E
Bought by
Blanchard Doug M and Kathleen Blanchard M
Home Financials for this Owner
Home Financials are based on the most recent Mortgage that was taken out on this home.
Original Mortgage
$97,650
Interest Rate
7.54%
Create a Home Valuation Report for This Property
The Home Valuation Report is an in-depth analysis detailing your home's value as well as a comparison with similar homes in the area
Home Values in the Area
Average Home Value in this Area
Purchase History
| Date | Buyer | Sale Price | Title Company |
|---|---|---|---|
| Owen Yassin S | -- | Timios Inc | |
| Owen Yassin S | -- | Access Title | |
| Blanchard Doug M | -- | Texas American Title Company |
Source: Public Records
Mortgage History
| Date | Status | Borrower | Loan Amount |
|---|---|---|---|
| Open | Owen Yassin S | $152,000 | |
| Closed | Owen Yassin S | $151,070 | |
| Previous Owner | Blanchard Doug M | $97,650 |
Source: Public Records
Tax History
| Year | Tax Paid | Tax Assessment Tax Assessment Total Assessment is a certain percentage of the fair market value that is determined by local assessors to be the total taxable value of land and additions on the property. | Land | Improvement |
|---|---|---|---|---|
| 2025 | $3,744 | $290,000 | $73,454 | $216,546 |
| 2024 | $3,744 | $298,413 | $65,647 | $232,766 |
| 2023 | $3,744 | $309,423 | $65,647 | $243,776 |
| 2022 | $5,212 | $289,433 | $50,389 | $239,044 |
| 2021 | $4,991 | $215,000 | $50,389 | $164,611 |
| 2020 | $4,669 | $226,329 | $41,872 | $184,457 |
| 2019 | $4,393 | $178,000 | $33,001 | $144,999 |
| 2018 | $1,644 | $174,000 | $33,001 | $140,999 |
| 2017 | $3,991 | $174,000 | $33,001 | $140,999 |
| 2016 | $3,991 | $174,000 | $33,001 | $140,999 |
| 2015 | $2,894 | $194,782 | $33,001 | $161,781 |
| 2014 | $2,894 | $168,236 | $27,678 | $140,558 |
Source: Public Records
Map
Nearby Homes
- 8014 Green Devon Dr
- 8203 Green Devon Dr
- 15918 Pinyon Creek Dr
- 8119 Silent Cedars Dr
- 8211 Riverglade Dr
- 16135 Ridge Park Dr
- 15947 Pinyon Creek Dr
- 15307 Forest Trails Dr
- 8130 Sunny Ridge Dr
- 7711 Brook Springs Dr
- 7731 Club Lake Dr
- 8407 Windy Cove Ct
- 7863 Maple Brook Ln
- 16030 Royal Garden Dr
- 8655 Plum Lake Dr
- 16114 Kintyre Point Rd
- 7710 Springville Dr
- 14955 Inverrary Dr
- 7906 Duncansby Vale Rd
- 8550 Sparkling Springs Dr
- 15702 Pinyon Creek Dr
- 15706 Pinyon Creek Dr
- 8002 Green Devon Dr
- 8027 Pine Falls Dr
- 15710 Pinyon Creek Dr
- 8003 Silver Fir Dr
- 8018 Pine Falls Dr
- 8022 Pine Falls Dr
- 8031 Pine Falls Dr
- 8006 Green Devon Dr
- 8014 Pine Falls Dr
- 8026 Pine Falls Dr
- 15714 Pinyon Creek Dr
- 8007 Silver Fir Dr
- 8010 Pine Falls Dr
- 8030 Pine Falls Dr
- 8010 Green Devon Dr
- 8035 Pine Falls Dr
- 15718 Pinyon Creek Dr
- 15703 Pinyon Creek Dr
Your Personal Tour Guide
Ask me questions while you tour the home.