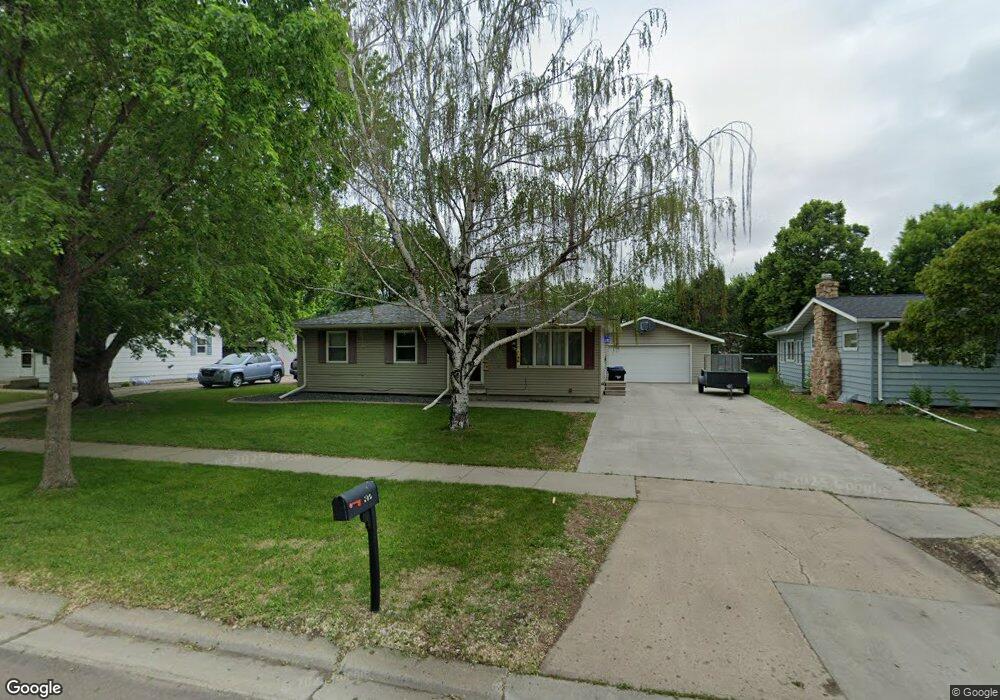
802 30th St N Fargo, ND 58102
Madison-Unicorn NeighborhoodEstimated Value: $251,794 - $292,000
2
Beds
2
Baths
2,008
Sq Ft
$133/Sq Ft
Est. Value
About This Home
This home is located at 802 30th St N, Fargo, ND 58102 and is currently estimated at $266,699, approximately $132 per square foot. 802 30th St N is a home located in Cass County with nearby schools including Madison Elementary School, Ben Franklin Middle School, and North High School.
Ownership History
Date
Name
Owned For
Owner Type
Purchase Details
Closed on
Mar 2, 2021
Sold by
Odenbach Kira A and Odenbach Devin M
Bought by
Odenbach Kira A and Odenbach Devin M
Current Estimated Value
Home Financials for this Owner
Home Financials are based on the most recent Mortgage that was taken out on this home.
Original Mortgage
$137,500
Outstanding Balance
$112,684
Interest Rate
2.7%
Mortgage Type
New Conventional
Estimated Equity
$154,015
Purchase Details
Closed on
Aug 12, 2014
Sold by
Battagler Cameron L and Battagler Jana
Bought by
Pederson Kira
Home Financials for this Owner
Home Financials are based on the most recent Mortgage that was taken out on this home.
Original Mortgage
$147,250
Interest Rate
4.1%
Mortgage Type
New Conventional
Purchase Details
Closed on
Nov 24, 2010
Sold by
Tvedten Tessa M and Ganske Tessa M
Bought by
Battagler Cameron L and Battagler Jana
Home Financials for this Owner
Home Financials are based on the most recent Mortgage that was taken out on this home.
Original Mortgage
$118,877
Interest Rate
4.45%
Mortgage Type
FHA
Create a Home Valuation Report for This Property
The Home Valuation Report is an in-depth analysis detailing your home's value as well as a comparison with similar homes in the area
Home Values in the Area
Average Home Value in this Area
Purchase History
| Date | Buyer | Sale Price | Title Company |
|---|---|---|---|
| Odenbach Kira A | -- | Fm Title | |
| Pederson Kira | $155,000 | Fm Title | |
| Battagler Cameron L | -- | -- |
Source: Public Records
Mortgage History
| Date | Status | Borrower | Loan Amount |
|---|---|---|---|
| Open | Odenbach Kira A | $137,500 | |
| Closed | Pederson Kira | $147,250 | |
| Previous Owner | Battagler Cameron L | $118,877 |
Source: Public Records
Tax History
| Year | Tax Paid | Tax Assessment Tax Assessment Total Assessment is a certain percentage of the fair market value that is determined by local assessors to be the total taxable value of land and additions on the property. | Land | Improvement |
|---|---|---|---|---|
| 2024 | $2,671 | $110,900 | $20,350 | $90,550 |
| 2023 | $2,987 | $104,600 | $20,350 | $84,250 |
| 2022 | $2,933 | $99,600 | $20,350 | $79,250 |
| 2021 | $2,675 | $88,950 | $20,350 | $68,600 |
| 2020 | $2,735 | $92,400 | $23,800 | $68,600 |
| 2019 | $2,397 | $79,450 | $11,050 | $68,400 |
| 2018 | $2,263 | $79,450 | $11,050 | $68,400 |
| 2017 | $2,143 | $75,650 | $11,050 | $64,600 |
| 2016 | $1,904 | $73,450 | $11,050 | $62,400 |
| 2015 | $1,898 | $68,600 | $9,350 | $59,250 |
| 2014 | $1,858 | $65,350 | $9,350 | $56,000 |
| 2013 | $1,775 | $62,250 | $9,350 | $52,900 |
Source: Public Records
Map
Nearby Homes
- 817 30th St N
- 910 32nd St N
- 914 32nd St N
- 3202-3204 10th Ave N
- 1022 26th St N
- 1026 16th St N
- 1044 16th St N
- 310 23rd St S
- 2213 5th Ave S
- 1419 4th Ave N
- 2126 5th Ave S
- 735 14th St N
- 729 14th St N
- 2209 6th Ave S
- 1524 1st Ave S
- 1010 University Dr N
- 1026 University Dr N
- 1450 1st Ave S
- 1317 1st Ave N
- 702 21st St S
Your Personal Tour Guide
Ask me questions while you tour the home.