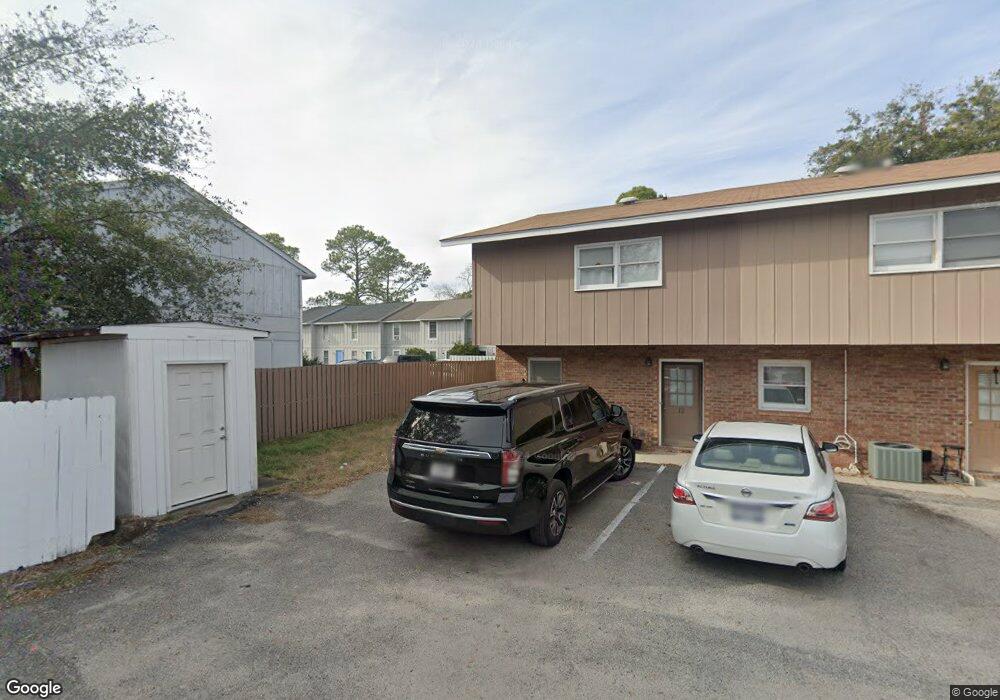
802 65th Ave N Myrtle Beach, SC 29572
Grande Dunes NeighborhoodEstimated Value: $178,000 - $263,151
2
Beds
2
Baths
1,024
Sq Ft
$200/Sq Ft
Est. Value
About This Home
This home is located at 802 65th Ave N, Myrtle Beach, SC 29572 and is currently estimated at $205,288, approximately $200 per square foot. 802 65th Ave N is a home located in Horry County with nearby schools including Myrtle Beach Child Development Center, Myrtle Beach Elementary School, and Myrtle Beach Primary School.
Ownership History
Date
Name
Owned For
Owner Type
Purchase Details
Closed on
Apr 20, 2018
Sold by
Cangu Florian
Bought by
Meggie Llc
Current Estimated Value
Purchase Details
Closed on
Sep 21, 2017
Sold by
Bussararungsee Teerasak
Bought by
Cangu Florian
Purchase Details
Closed on
May 24, 2007
Sold by
Blake Kristy L
Bought by
Bussararungsee Teerasak
Home Financials for this Owner
Home Financials are based on the most recent Mortgage that was taken out on this home.
Original Mortgage
$70,000
Interest Rate
6.16%
Mortgage Type
Purchase Money Mortgage
Purchase Details
Closed on
Mar 17, 2006
Sold by
Blake Steven G
Bought by
Blake Kristy L
Purchase Details
Closed on
Jan 20, 2005
Sold by
Stradley Richard L
Bought by
Lee Blake Steven George and Lee Blake Kristy
Home Financials for this Owner
Home Financials are based on the most recent Mortgage that was taken out on this home.
Original Mortgage
$68,000
Interest Rate
5.66%
Mortgage Type
Purchase Money Mortgage
Purchase Details
Closed on
Feb 22, 2002
Sold by
Corkum Marilyn L
Bought by
Stradley Richard L and The Kerem Nachal Trust
Create a Home Valuation Report for This Property
The Home Valuation Report is an in-depth analysis detailing your home's value as well as a comparison with similar homes in the area
Home Values in the Area
Average Home Value in this Area
Purchase History
| Date | Buyer | Sale Price | Title Company |
|---|---|---|---|
| Meggie Llc | -- | -- | |
| Cangu Florian | $84,000 | -- | |
| Bussararungsee Teerasak | $105,000 | None Available | |
| Blake Kristy L | -- | None Available | |
| Lee Blake Steven George | $75,000 | -- | |
| Stradley Richard L | $54,000 | -- |
Source: Public Records
Mortgage History
| Date | Status | Borrower | Loan Amount |
|---|---|---|---|
| Previous Owner | Bussararungsee Teerasak | $70,000 | |
| Previous Owner | Lee Blake Steven George | $68,000 |
Source: Public Records
Tax History Compared to Growth
Tax History
| Year | Tax Paid | Tax Assessment Tax Assessment Total Assessment is a certain percentage of the fair market value that is determined by local assessors to be the total taxable value of land and additions on the property. | Land | Improvement |
|---|---|---|---|---|
| 2024 | $1,477 | $12,925 | $6,000 | $6,925 |
| 2023 | $1,477 | $5,040 | $918 | $4,122 |
| 2021 | $1,362 | $5,040 | $918 | $4,122 |
| 2020 | $1,490 | $5,784 | $918 | $4,866 |
| 2019 | $1,490 | $5,784 | $918 | $4,866 |
| 2018 | $1,402 | $5,268 | $600 | $4,668 |
| 2017 | $0 | $5,268 | $600 | $4,668 |
| 2016 | $0 | $5,268 | $600 | $4,668 |
| 2015 | -- | $5,268 | $600 | $4,668 |
| 2014 | $1,332 | $5,268 | $600 | $4,668 |
Source: Public Records
Map
Nearby Homes
- 6500 Colonial Dr Unit 2
- 6312 Timberline St Unit B
- 806 Duncan Ave
- 713 67th Ave N Unit E
- 712 67th Ave N Unit 1E
- 6204 Sancindy Ln
- 701 67th Ave N
- 6703 Jefferson Place Unit B-2
- 6703 Jefferson Place Unit G5
- 6703 Jefferson Place Unit B4
- TBD Bryant St. Bryant St Unit BRYANT DR; PARCEL 2-
- 6723 Ocean Breeze Loop
- 6702 Jefferson Place Unit F2
- 6702 Jefferson Place Unit C6
- 6702 Jefferson Place Unit B6
- 6702 Jefferson Place Unit C3
- 6708 Bryant St Unit E
- 6703 Bryant St
- 6703 Bryant St Unit A
- TBD 67th Ave N
- 802 65th Ave N Unit F Westwood Townhouse
- 802 65th Ave N
- 802 65th Ave N
- 802 65th Ave N Unit K
- 802 65th Ave N Unit J
- 802 65th Ave N Unit I
- 802 65th Ave N Unit H
- 802 65th Ave N Unit F
- 802 65th Ave N Unit E
- 802 65th Ave N
- 802 65th Ave N Unit C
- 802 65th Ave N Unit A
- 802 65th Ave N Unit D Westwood Townhomes
- 802L 65th Ave N Unit L
- 805 66th Ave N Unit A
- 805 66th Ave N
- 805 66th Ave N Unit D
- 805 66th Ave N Unit C
- 805 66th Ave N Unit B
- 805 66th Ave N Unit I