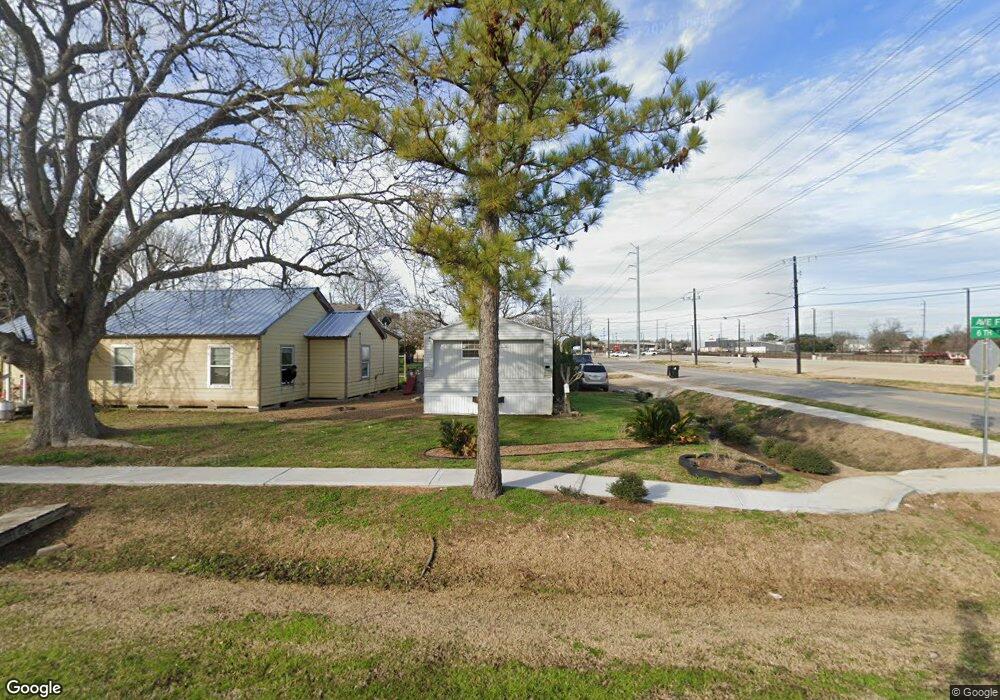
802 6th St Rosenberg, TX 77471
Estimated Value: $232,000
3
Beds
2
Baths
1,232
Sq Ft
$188/Sq Ft
Est. Value
About This Home
This home is located at 802 6th St, Rosenberg, TX 77471 and is currently estimated at $232,000, approximately $188 per square foot. 802 6th St is a home located in Fort Bend County with nearby schools including Travis Elementary School, George Junior High School, and B.F. Terry High School.
Ownership History
Date
Name
Owned For
Owner Type
Purchase Details
Closed on
Feb 17, 2015
Sold by
City Of Rosenberg Etal
Bought by
Scott Terry
Current Estimated Value
Purchase Details
Closed on
Apr 2, 2014
Sold by
Cavazos Ignacio and Cavazos Lupe
Bought by
City Of Rosenberg
Purchase Details
Closed on
Feb 4, 2014
Sold by
Cavazos Ignacio and Cavazos Lupe
Bought by
Scott Terry
Purchase Details
Closed on
Sep 20, 1999
Sold by
Albarran Ismael Samuel and Albarran Lucila
Bought by
Ramirez Enrique Perez
Purchase Details
Closed on
Jun 1, 1996
Sold by
Gutierrez Vivian and Danaches Lorna
Bought by
Perez Leonardo and Perez Sandra
Home Financials for this Owner
Home Financials are based on the most recent Mortgage that was taken out on this home.
Original Mortgage
$48,600
Interest Rate
7.92%
Mortgage Type
Seller Take Back
Purchase Details
Closed on
Mar 31, 1987
Sold by
Zwahr George Eta
Bought by
Scott Terry
Create a Home Valuation Report for This Property
The Home Valuation Report is an in-depth analysis detailing your home's value as well as a comparison with similar homes in the area
Home Values in the Area
Average Home Value in this Area
Purchase History
| Date | Buyer | Sale Price | Title Company |
|---|---|---|---|
| Scott Terry | -- | -- | |
| City Of Rosenberg | -- | None Available | |
| Scott Terry | -- | -- | |
| Ramirez Enrique Perez | -- | -- | |
| Perez Leonardo | -- | -- | |
| Scott Terry | -- | -- |
Source: Public Records
Mortgage History
| Date | Status | Borrower | Loan Amount |
|---|---|---|---|
| Previous Owner | Perez Leonardo | $48,600 |
Source: Public Records
Tax History
| Year | Tax Paid | Tax Assessment Tax Assessment Total Assessment is a certain percentage of the fair market value that is determined by local assessors to be the total taxable value of land and additions on the property. | Land | Improvement |
|---|---|---|---|---|
| 2025 | $3,451 | $137,496 | $31,712 | $105,784 |
| 2024 | $3,451 | $182,674 | $31,712 | $150,962 |
| 2023 | $3,276 | $169,681 | $31,712 | $137,969 |
| 2022 | $2,166 | $105,760 | $31,710 | $74,050 |
| 2021 | $1,382 | $66,620 | $19,030 | $47,590 |
| 2020 | $1,423 | $67,070 | $19,030 | $48,040 |
| 2019 | $1,524 | $66,730 | $19,030 | $47,700 |
| 2018 | $1,489 | $64,140 | $19,030 | $45,110 |
| 2017 | $1,460 | $62,550 | $19,030 | $43,520 |
| 2016 | $1,461 | $62,610 | $19,030 | $43,580 |
| 2015 | $1,300 | $63,820 | $19,030 | $44,790 |
| 2014 | $141 | $63,850 | $19,030 | $44,820 |
Source: Public Records
Map
Nearby Homes
Your Personal Tour Guide
Ask me questions while you tour the home.