Estimated Value: $486,660 - $630,000
4
Beds
4
Baths
2,970
Sq Ft
$181/Sq Ft
Est. Value
About This Home
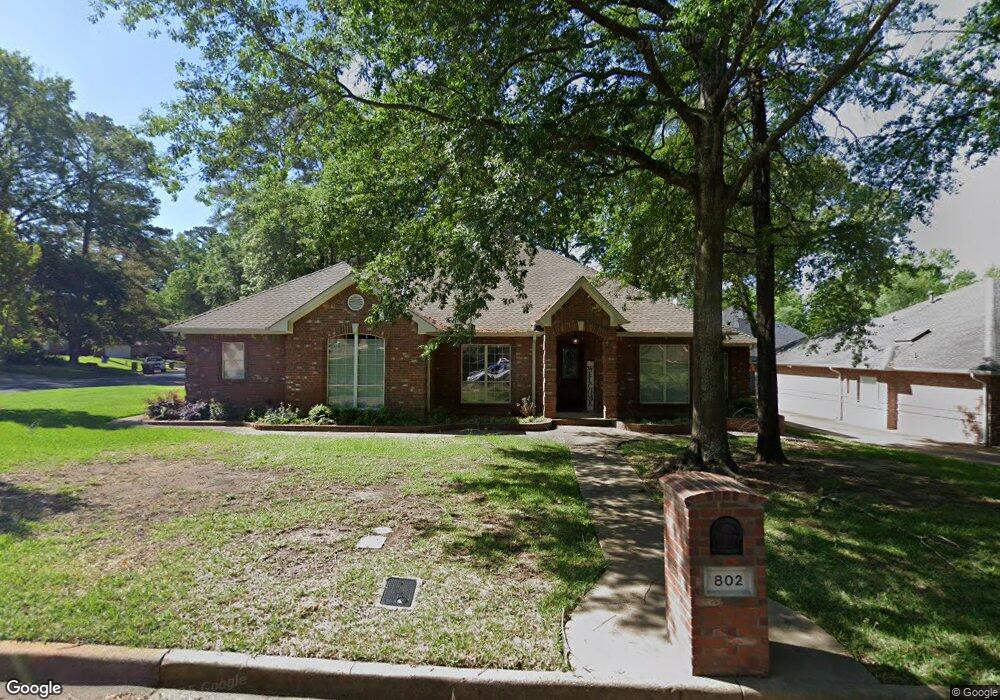
This home is located at 802 802 Kingswood Dr, Tyler, TX 75703 and is currently estimated at $538,665, approximately $181 per square foot. 802 802 Kingswood Dr is a home located in Smith County with nearby schools including Rice Elementary School, Hubbard Middle School, and Tyler Legacy High School.
Ownership History
Date
Name
Owned For
Owner Type
Purchase Details
Closed on
Jul 22, 2024
Sold by
Cochrane Jessica Suzanne and Conrad Jessica S
Bought by
Sturgeon Ivan and Sturgeon Robyn Leanne
Current Estimated Value
Home Financials for this Owner
Home Financials are based on the most recent Mortgage that was taken out on this home.
Original Mortgage
$465,500
Outstanding Balance
$459,525
Interest Rate
6.99%
Mortgage Type
New Conventional
Estimated Equity
$79,140
Purchase Details
Closed on
Aug 3, 2020
Sold by
Terry Oliver Lloyd and Terry Micheal Lloyd
Bought by
Cochrane Jessica Suzanne
Home Financials for this Owner
Home Financials are based on the most recent Mortgage that was taken out on this home.
Original Mortgage
$321,000
Interest Rate
3%
Mortgage Type
New Conventional
Create a Home Valuation Report for This Property
The Home Valuation Report is an in-depth analysis detailing your home's value as well as a comparison with similar homes in the area
Home Values in the Area
Average Home Value in this Area
Purchase History
| Date | Buyer | Sale Price | Title Company |
|---|---|---|---|
| Sturgeon Ivan | -- | None Listed On Document | |
| Cochrane Jessica Suzanne | -- | None Available |
Source: Public Records
Mortgage History
| Date | Status | Borrower | Loan Amount |
|---|---|---|---|
| Open | Sturgeon Ivan | $465,500 | |
| Previous Owner | Cochrane Jessica Suzanne | $321,000 |
Source: Public Records
Tax History Compared to Growth
Tax History
| Year | Tax Paid | Tax Assessment Tax Assessment Total Assessment is a certain percentage of the fair market value that is determined by local assessors to be the total taxable value of land and additions on the property. | Land | Improvement |
|---|---|---|---|---|
| 2025 | $6,636 | $568,897 | $45,383 | $523,514 |
| 2024 | $6,636 | $451,870 | $62,125 | $528,743 |
| 2023 | $6,072 | $518,377 | $62,125 | $456,252 |
| 2022 | $7,316 | $406,593 | $44,375 | $362,218 |
| 2021 | $7,123 | $339,496 | $44,375 | $295,121 |
| 2020 | $7,865 | $367,546 | $44,375 | $323,171 |
| 2019 | $7,307 | $334,136 | $35,500 | $298,636 |
| 2018 | $7,334 | $337,213 | $35,500 | $301,713 |
| 2017 | $7,199 | $337,213 | $35,500 | $301,713 |
| 2016 | $6,904 | $323,362 | $35,500 | $287,862 |
| 2015 | $4,037 | $314,121 | $35,500 | $278,621 |
| 2014 | $4,037 | $298,146 | $35,500 | $262,646 |
Source: Public Records
Map
Nearby Homes
- 716 Chimney Rock Dr
- 5802 Briar Creek Dr
- 6001 Huntington Dr
- 973 Creekside Dr
- 709 W Rieck Rd
- 1212 Parkview Dr
- 717 Meadow Creek Dr
- 608 Top Hill Dr
- 5900 Stoneleigh Dr
- 709 Top Hill Dr
- 5803 Stoneleigh Dr
- 800 Spring Creek Dr
- 5401 Hollytree Dr
- 5401 Hollytree Dr Unit 1002
- 5701 Plantation Dr
- 802 Carriage Dr
- 601 Carriage Dr
- 5829 Brynmar Ct
- 842 Carriage Dr
- 704 Paloma St
- 802 Kingswood Dr
- 806 Kingswood Dr
- 5805 Woodglen Dr
- 801 801 Kingswood
- 805 805 Kingswood
- 810 Kingswood Dr
- 805 Kingswood Dr
- 801 Kingswood Dr
- 5809 5809 Woodglen Dr
- 5809 Woodglen Dr
- 809 Kingswood Dr
- 717 Kingswood Dr
- 717 717 Kingswood Dr
- 5806 Woodglen Dr
- 712 712 Kingswood
- 1802 Kingswood Dr
- 712 Kingswood Dr
- 814 814 Kingswood Dr
- 5812 Spring Creek Dr
- 814 Kingswood Dr