802 Azalea Dr Lagrange, GA 30240
Estimated Value: $378,005 - $547,000
4
Beds
3
Baths
2,923
Sq Ft
$153/Sq Ft
Est. Value
About This Home
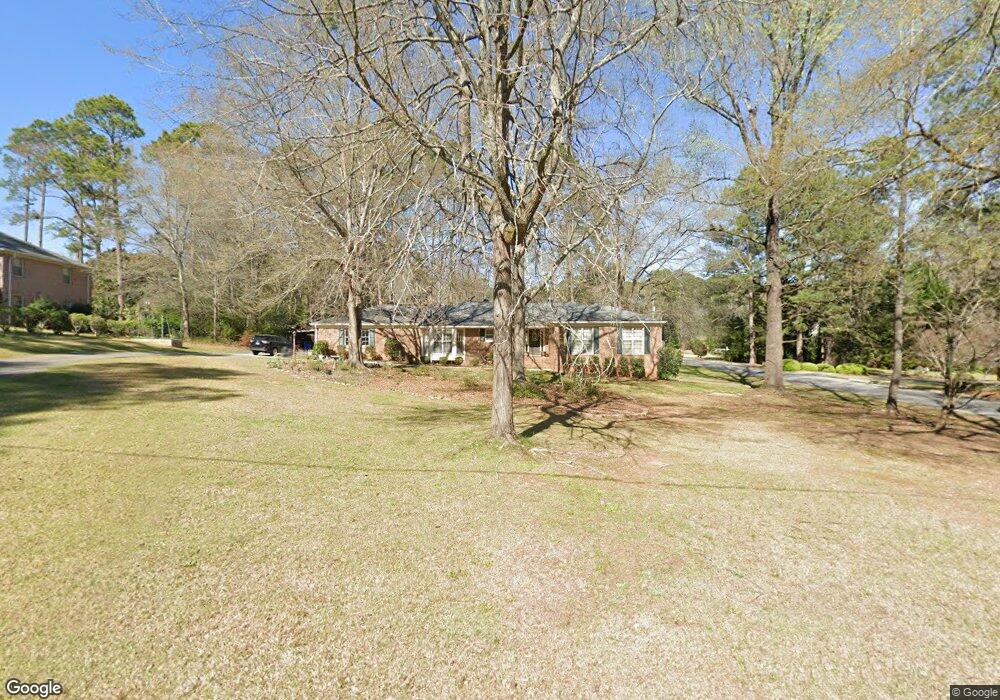
This home is located at 802 Azalea Dr, Lagrange, GA 30240 and is currently estimated at $446,001, approximately $152 per square foot. 802 Azalea Dr is a home located in Troup County with nearby schools including Hollis Hand Elementary School, Franklin Forest Elementary School, and Ethel W. Kight Elementary School.
Ownership History
Date
Name
Owned For
Owner Type
Purchase Details
Closed on
May 20, 2013
Sold by
Wolfe Ricky P
Bought by
Lovejoy William Kyle
Current Estimated Value
Home Financials for this Owner
Home Financials are based on the most recent Mortgage that was taken out on this home.
Original Mortgage
$261,477
Outstanding Balance
$182,871
Interest Rate
3.42%
Mortgage Type
New Conventional
Estimated Equity
$263,130
Purchase Details
Closed on
Jan 15, 2010
Sold by
Yates Nelle W
Bought by
Wolfe John P and Wolfe Leslie P
Home Financials for this Owner
Home Financials are based on the most recent Mortgage that was taken out on this home.
Original Mortgage
$200,500
Interest Rate
4.94%
Mortgage Type
New Conventional
Purchase Details
Closed on
Feb 22, 1996
Sold by
Richard P Yates
Bought by
Yates Nelle W
Purchase Details
Closed on
Jan 20, 1975
Sold by
Vonlehe Catherine E
Bought by
Richard P Yates
Purchase Details
Closed on
Jan 1, 1967
Sold by
Piney Woods Co
Bought by
Vonlehe Catherine E
Create a Home Valuation Report for This Property
The Home Valuation Report is an in-depth analysis detailing your home's value as well as a comparison with similar homes in the area
Purchase History
| Date | Buyer | Sale Price | Title Company |
|---|---|---|---|
| Lovejoy William Kyle | $270,000 | -- | |
| Wolfe John P | $267,500 | -- | |
| Yates Nelle W | -- | -- | |
| Richard P Yates | $58,000 | -- | |
| Vonlehe Catherine E | -- | -- |
Source: Public Records
Mortgage History
| Date | Status | Borrower | Loan Amount |
|---|---|---|---|
| Open | Lovejoy William Kyle | $261,477 | |
| Previous Owner | Wolfe John P | $200,500 |
Source: Public Records
Tax History
| Year | Tax Paid | Tax Assessment Tax Assessment Total Assessment is a certain percentage of the fair market value that is determined by local assessors to be the total taxable value of land and additions on the property. | Land | Improvement |
|---|---|---|---|---|
| 2025 | $3,109 | $149,040 | $16,000 | $133,040 |
| 2024 | $3,109 | $114,000 | $16,000 | $98,000 |
| 2023 | $2,931 | $107,480 | $16,000 | $91,480 |
| 2022 | $2,860 | $102,480 | $16,000 | $86,480 |
| 2021 | $2,872 | $95,240 | $16,000 | $79,240 |
| 2020 | $2,872 | $95,240 | $16,000 | $79,240 |
| 2019 | $3,067 | $101,680 | $16,000 | $85,680 |
| 2018 | $2,942 | $97,560 | $16,000 | $81,560 |
| 2017 | $2,936 | $97,360 | $16,000 | $81,360 |
| 2016 | $2,936 | $97,337 | $16,000 | $81,337 |
| 2015 | $2,941 | $97,337 | $16,000 | $81,337 |
| 2014 | $2,895 | $95,660 | $16,000 | $79,660 |
| 2013 | -- | $75,452 | $14,000 | $61,452 |
Source: Public Records
Map
Nearby Homes
- 724 Camellia Dr
- 732 Camellia Dr
- 203 S Chilton Crescent
- 201 S Chilton Crescent
- 106 Ewing St
- 116 Wisteria Ridge Terrace
- 222 Beechwood Cir
- 102 Beech Creek Dr
- 204 Dixie Creek Dr
- 705 Piney Woods Dr
- 110 Russell St
- 204 Colonial St
- 109 Thomas St
- 900 North St
- 219 Banks St
- 806 New Franklin Rd
- 120 Saynor Cir
- 105 Saynor Cir
- 114 Briarcliff Rd
- 216 E Lane Cir
- 808 Azalea Dr
- 770 Azalea Dr
- 202 Ivydale Dr
- 801 Wisteria Way
- 812 Azalea Dr
- 807 Azalea Dr
- 713 Wisteria Way
- 764 Azalea Dr
- 769 Azalea Dr
- 803 Wisteria Way
- 101 Ivydale Dr
- 711 Wisteria Way
- 805 Wisteria Way
- 811 Azalea Dr
- 816 Azalea Dr
- 763 Azalea Dr
- 802 Wisteria Way
- 99 Ivydale Dr
- 299 Ivydale Dr
- 709 Wisteria Way
Your Personal Tour Guide
Ask me questions while you tour the home.