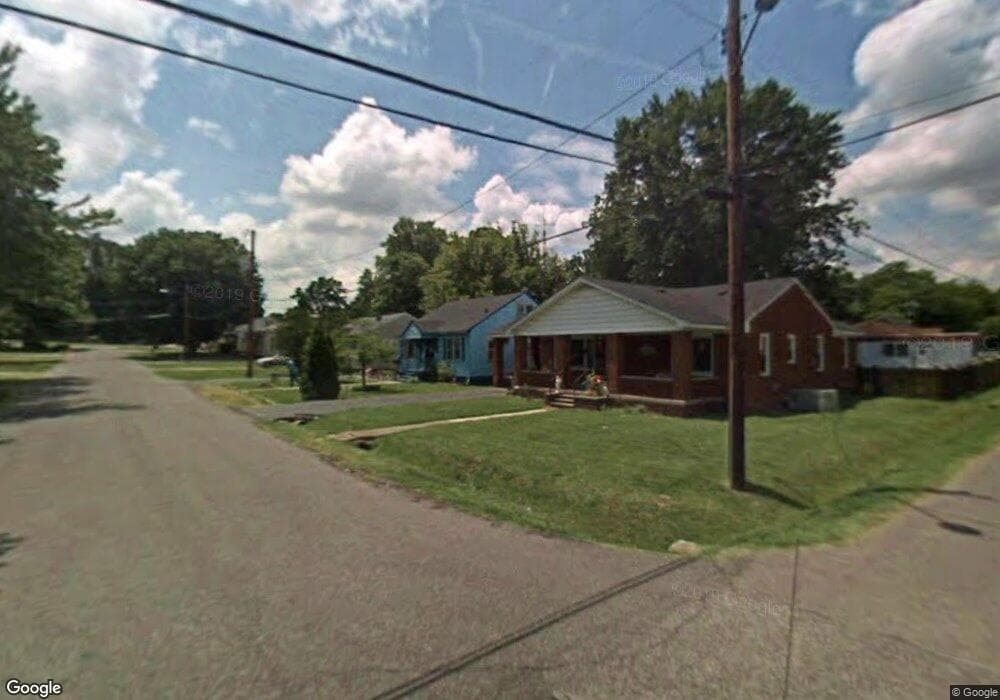
802 Birch St Benton, KY 42025
Estimated Value: $66,000 - $127,000
4
Beds
2
Baths
1,584
Sq Ft
$54/Sq Ft
Est. Value
About This Home
This home is located at 802 Birch St, Benton, KY 42025 and is currently estimated at $85,900, approximately $54 per square foot. 802 Birch St is a home located in Marshall County with nearby schools including Benton Elementary School and Marshall County High School.
Ownership History
Date
Name
Owned For
Owner Type
Purchase Details
Closed on
Mar 31, 2022
Sold by
Mann Douglas A and Mann Janet M
Bought by
Mann Douglas A and Mann Janet M
Current Estimated Value
Purchase Details
Closed on
Jan 17, 2014
Sold by
Goodman John Steven
Bought by
Williams Susan H
Purchase Details
Closed on
Jul 11, 2007
Sold by
Goodman John Steven and Williams Susan H
Bought by
Goodman John Steven and Williams Susan H
Home Financials for this Owner
Home Financials are based on the most recent Mortgage that was taken out on this home.
Original Mortgage
$33,750
Interest Rate
6.52%
Mortgage Type
Purchase Money Mortgage
Purchase Details
Closed on
Sep 29, 2006
Sold by
Williams Dortha Dean
Bought by
Goodman John Steven
Home Financials for this Owner
Home Financials are based on the most recent Mortgage that was taken out on this home.
Original Mortgage
$31,800
Interest Rate
6.48%
Mortgage Type
New Conventional
Create a Home Valuation Report for This Property
The Home Valuation Report is an in-depth analysis detailing your home's value as well as a comparison with similar homes in the area
Home Values in the Area
Average Home Value in this Area
Purchase History
| Date | Buyer | Sale Price | Title Company |
|---|---|---|---|
| Mann Douglas A | -- | Long & Long Pllc | |
| Williams Susan H | -- | None Available | |
| Goodman John Steven | -- | None Available | |
| Goodman John Steven | $31,800 | None Available |
Source: Public Records
Mortgage History
| Date | Status | Borrower | Loan Amount |
|---|---|---|---|
| Previous Owner | Goodman John Steven | $33,750 | |
| Previous Owner | Goodman John Steven | $31,800 |
Source: Public Records
Tax History
| Year | Tax Paid | Tax Assessment Tax Assessment Total Assessment is a certain percentage of the fair market value that is determined by local assessors to be the total taxable value of land and additions on the property. | Land | Improvement |
|---|---|---|---|---|
| 2025 | $80 | $9,000 | $7,000 | $2,000 |
| 2024 | $82 | $9,000 | $7,000 | $2,000 |
| 2023 | $141 | $15,000 | $0 | $0 |
| 2022 | $59 | $6,000 | $5,000 | $1,000 |
| 2021 | $60 | $6,000 | $5,000 | $1,000 |
| 2020 | $60 | $6,000 | $5,000 | $1,000 |
| 2019 | $60 | $6,000 | $5,000 | $1,000 |
| 2018 | $61 | $6,000 | $5,000 | $1,000 |
| 2017 | $61 | $6,000 | $5,000 | $1,000 |
| 2016 | $61 | $6,000 | $5,000 | $1,000 |
| 2015 | $61 | $6,000 | $5,000 | $1,000 |
| 2014 | -- | $31,800 | $0 | $0 |
| 2010 | -- | $31,800 | $5,000 | $26,800 |
Source: Public Records
Map
Nearby Homes
- 00 Main St
- 301 E 13th St
- 318 Main St
- 320 Main St
- 00 W 12th St
- 102 Harper Dr
- 901 Pine St
- TBD W 5th St
- 205 E 15th St
- 220 Morningside Dr
- 1208 Shelby McCallum Dr
- Lot 33 Woodtrace Subdivision
- Lot 34 & 35 Woodtrace Subdivision
- 522 W 12th St
- 1289 Bethel Rd
- 213 W 16th St
- 103 Farley Heights
- 501 Old Symsonia Rd
- 1505 Main St
- 1.35 Acres on Main St
Your Personal Tour Guide
Ask me questions while you tour the home.