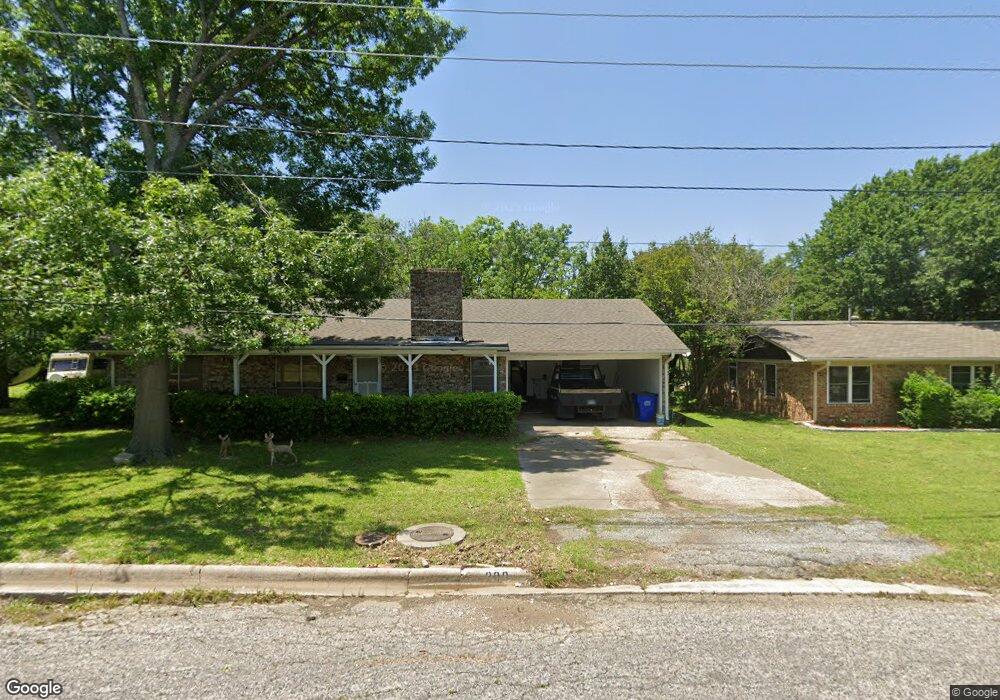
802 Carver St Whitesboro, TX 76273
Estimated Value: $242,271 - $314,000
3
Beds
2
Baths
2,546
Sq Ft
$109/Sq Ft
Est. Value
About This Home
This home is located at 802 Carver St, Whitesboro, TX 76273 and is currently estimated at $278,136, approximately $109 per square foot. 802 Carver St is a home located in Grayson County with nearby schools including J.W. Hayes Primary School, Whitesboro Intermediate School, and Whitesboro Middle School.
Ownership History
Date
Name
Owned For
Owner Type
Purchase Details
Closed on
Jan 27, 2015
Sold by
Federal National Mortgage Association
Bought by
Middleton John R
Current Estimated Value
Home Financials for this Owner
Home Financials are based on the most recent Mortgage that was taken out on this home.
Original Mortgage
$82,650
Outstanding Balance
$63,467
Interest Rate
3.83%
Mortgage Type
New Conventional
Estimated Equity
$214,669
Purchase Details
Closed on
Mar 2, 2014
Sold by
Hedges R C and Hedges Jean
Bought by
Federal National Mortgage Association and Fannie Mae
Create a Home Valuation Report for This Property
The Home Valuation Report is an in-depth analysis detailing your home's value as well as a comparison with similar homes in the area
Home Values in the Area
Average Home Value in this Area
Purchase History
| Date | Buyer | Sale Price | Title Company |
|---|---|---|---|
| Middleton John R | -- | Grayson County Title | |
| Federal National Mortgage Association | $224,305 | None Available |
Source: Public Records
Mortgage History
| Date | Status | Borrower | Loan Amount |
|---|---|---|---|
| Open | Middleton John R | $82,650 |
Source: Public Records
Tax History Compared to Growth
Tax History
| Year | Tax Paid | Tax Assessment Tax Assessment Total Assessment is a certain percentage of the fair market value that is determined by local assessors to be the total taxable value of land and additions on the property. | Land | Improvement |
|---|---|---|---|---|
| 2025 | $2,637 | $204,479 | -- | -- |
| 2024 | $3,662 | $185,890 | $0 | $0 |
| 2023 | $2,164 | $168,991 | $0 | $0 |
| 2022 | $3,028 | $153,628 | $0 | $0 |
| 2021 | $2,994 | $139,662 | $4,373 | $135,289 |
| 2020 | $3,273 | $147,484 | $13,032 | $134,452 |
| 2019 | $3,129 | $133,259 | $14,169 | $119,090 |
| 2018 | $3,311 | $162,738 | $14,169 | $148,569 |
| 2017 | $2,715 | $112,194 | $13,295 | $98,899 |
| 2016 | $2,646 | $109,357 | $7,959 | $101,398 |
| 2015 | $2,396 | $97,731 | $7,959 | $89,772 |
| 2014 | $2,541 | $103,606 | $7,959 | $95,647 |
Source: Public Records
Map
Nearby Homes