Estimated Value: $182,000 - $219,329
3
Beds
2
Baths
2,188
Sq Ft
$95/Sq Ft
Est. Value
About This Home
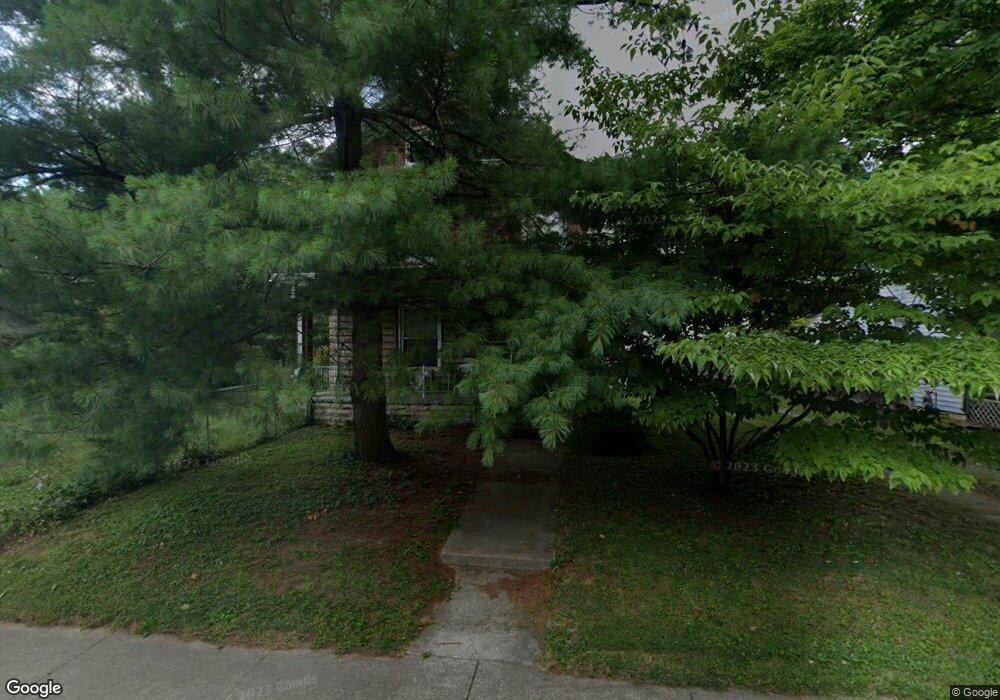
This home is located at 802 Chestnut St, Xenia, OH 45385 and is currently estimated at $207,082, approximately $94 per square foot. 802 Chestnut St is a home located in Greene County with nearby schools including Xenia High School, Summit Academy Community School for Alternative Learners - Xenia, and Legacy Christian Academy.
Ownership History
Date
Name
Owned For
Owner Type
Purchase Details
Closed on
Apr 3, 2024
Sold by
Roth Sharon G and Kirby Sharon G
Bought by
Kirby Dale J and Kirby Sharon G
Current Estimated Value
Purchase Details
Closed on
Oct 25, 2012
Sold by
Roth Andrew J
Bought by
Kunselman Sharon G and Roth Sharon G
Purchase Details
Closed on
Dec 23, 2003
Sold by
Roth Sharon G and Kunselman Sharon G
Bought by
Roth Andrew J and Roth Sharon G
Home Financials for this Owner
Home Financials are based on the most recent Mortgage that was taken out on this home.
Original Mortgage
$84,656
Interest Rate
5.84%
Mortgage Type
New Conventional
Purchase Details
Closed on
Jul 19, 1995
Sold by
Fankell Kenneth L
Bought by
Kunselman Sharon G
Home Financials for this Owner
Home Financials are based on the most recent Mortgage that was taken out on this home.
Original Mortgage
$74,400
Interest Rate
7.88%
Mortgage Type
New Conventional
Create a Home Valuation Report for This Property
The Home Valuation Report is an in-depth analysis detailing your home's value as well as a comparison with similar homes in the area
Home Values in the Area
Average Home Value in this Area
Purchase History
| Date | Buyer | Sale Price | Title Company |
|---|---|---|---|
| Kirby Dale J | -- | None Listed On Document | |
| Kunselman Sharon G | -- | None Available | |
| Roth Andrew J | -- | Sterling Land Title Agency I | |
| Kunselman Sharon G | $93,000 | -- |
Source: Public Records
Mortgage History
| Date | Status | Borrower | Loan Amount |
|---|---|---|---|
| Previous Owner | Roth Andrew J | $84,656 | |
| Previous Owner | Kunselman Sharon G | $74,400 |
Source: Public Records
Tax History Compared to Growth
Tax History
| Year | Tax Paid | Tax Assessment Tax Assessment Total Assessment is a certain percentage of the fair market value that is determined by local assessors to be the total taxable value of land and additions on the property. | Land | Improvement |
|---|---|---|---|---|
| 2024 | $2,571 | $60,080 | $7,000 | $53,080 |
| 2023 | $2,571 | $60,080 | $7,000 | $53,080 |
| 2022 | $2,217 | $45,290 | $5,600 | $39,690 |
| 2021 | $2,247 | $45,290 | $5,600 | $39,690 |
| 2020 | $2,111 | $45,290 | $5,600 | $39,690 |
| 2019 | $2,111 | $41,820 | $3,500 | $38,320 |
| 2018 | $2,119 | $41,820 | $3,500 | $38,320 |
| 2017 | $2,014 | $41,820 | $3,500 | $38,320 |
| 2016 | $2,015 | $39,030 | $3,500 | $35,530 |
| 2015 | $2,020 | $39,030 | $3,500 | $35,530 |
| 2014 | $1,933 | $39,030 | $3,500 | $35,530 |
Source: Public Records
Map
Nearby Homes
- 633 Xenia Ave
- 46 Lake St
- 100 Prugh Ave
- 293 S Miami Ave
- 260 Pocahontas St
- 148 Home Ave
- 530 Cincinnati Ave
- 453 Walnut St
- 400 S Detroit St
- 523 Newport Rd
- 222 Washington St
- 305-325 Bellbrook Ave
- 36 Leaman St
- 75 W 2nd St
- 373 Hill St
- 240 E 2nd St
- 0 W Church St
- 214 Corwin Ave
- 1208 Bellbrook Ave
- 541 E Main St
- 802 Chestnut St
- 784 Chestnut St
- 792 Chestnut St
- 768 Chestnut St
- 799 Xenia Ave
- 761 Xenia Ave
- 820 Chestnut St
- 828 Chestnut St
- 758 Chestnut St
- 817 Xenia Ave
- 749 Xenia Ave
- 752 Chestnut St
- 825 Xenia Ave
- 805 Chestnut St
- 96 Stelton Rd
- 813 Chestnut St
- 781 Chestnut St
- 741 Xenia Ave
- 825 Chestnut St
- 769 Chestnut St