Estimated Value: $352,000 - $458,016
3
Beds
2
Baths
1,596
Sq Ft
$243/Sq Ft
Est. Value
About This Home
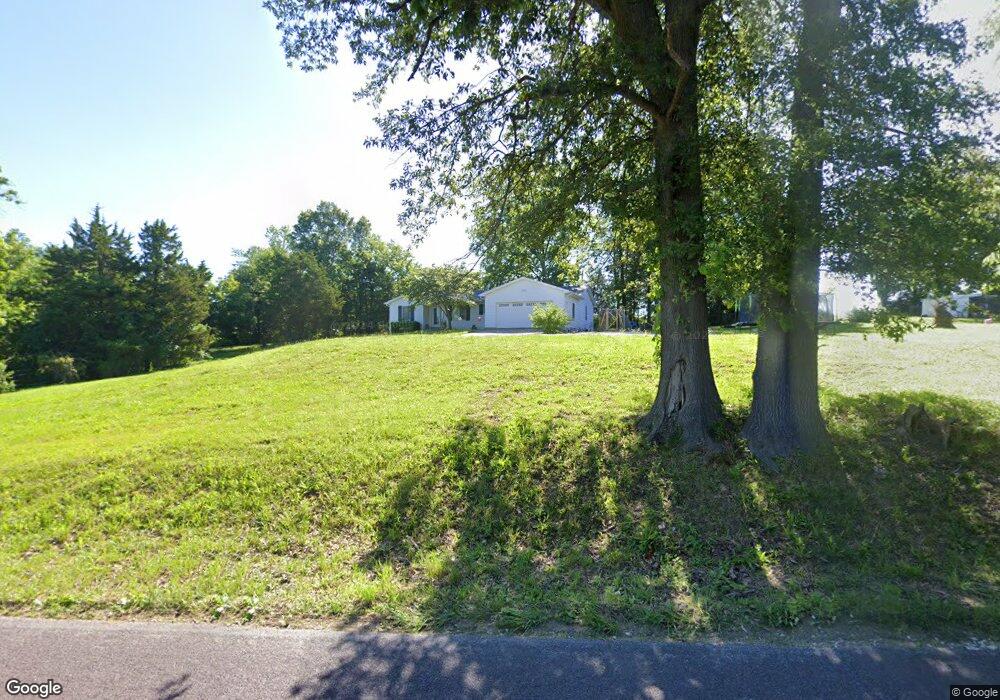
This home is located at 802 Creech School Rd, Troy, MO 63379 and is currently estimated at $388,005, approximately $243 per square foot. 802 Creech School Rd is a home located in Lincoln County with nearby schools including Cuivre Park Elementary School, Troy South Middle School, and Troy Buchanan High School.
Ownership History
Date
Name
Owned For
Owner Type
Purchase Details
Closed on
Jun 30, 2016
Sold by
Harrell Harrel L and Harrell Pamela J
Bought by
Lester Randy E
Current Estimated Value
Purchase Details
Closed on
Oct 10, 2013
Sold by
Harrell Howard D and Harrell Howard Dale
Bought by
Harrell Howard D and Harrell Pamela J
Home Financials for this Owner
Home Financials are based on the most recent Mortgage that was taken out on this home.
Original Mortgage
$150,000
Interest Rate
4.61%
Mortgage Type
New Conventional
Purchase Details
Closed on
May 30, 2012
Sold by
Dixon Janet Elaine and Harrell Janet Elaine
Bought by
Harrell Howard Dale
Purchase Details
Closed on
Mar 31, 2008
Sold by
Harrell Howard D and Harrell Janet E
Bought by
Harrell Howard D
Home Financials for this Owner
Home Financials are based on the most recent Mortgage that was taken out on this home.
Original Mortgage
$136,000
Interest Rate
6.19%
Mortgage Type
New Conventional
Create a Home Valuation Report for This Property
The Home Valuation Report is an in-depth analysis detailing your home's value as well as a comparison with similar homes in the area
Purchase History
| Date | Buyer | Sale Price | Title Company |
|---|---|---|---|
| Lester Randy E | -- | Meyer Title Co | |
| Harrell Howard D | -- | None Available | |
| Harrell Howard Dale | -- | None Available | |
| Harrell Howard D | -- | None Available |
Source: Public Records
Mortgage History
| Date | Status | Borrower | Loan Amount |
|---|---|---|---|
| Previous Owner | Harrell Howard D | $150,000 | |
| Previous Owner | Harrell Howard D | $136,000 |
Source: Public Records
Tax History
| Year | Tax Paid | Tax Assessment Tax Assessment Total Assessment is a certain percentage of the fair market value that is determined by local assessors to be the total taxable value of land and additions on the property. | Land | Improvement |
|---|---|---|---|---|
| 2025 | $2,015 | $33,142 | $5,193 | $27,949 |
| 2024 | $1,901 | $30,499 | $4,686 | $25,813 |
| 2023 | $1,890 | $30,683 | $4,870 | $25,813 |
| 2022 | $1,809 | $29,040 | $4,686 | $24,354 |
| 2021 | $1,818 | $151,496 | $0 | $0 |
| 2020 | $1,618 | $134,616 | $0 | $0 |
| 2019 | $1,620 | $134,616 | $0 | $0 |
| 2018 | $1,557 | $24,516 | $0 | $0 |
| 2017 | $1,561 | $24,516 | $0 | $0 |
| 2016 | $1,312 | $20,098 | $0 | $0 |
| 2015 | $1,316 | $20,098 | $0 | $0 |
| 2014 | $1,279 | $19,489 | $0 | $0 |
| 2013 | -- | $19,489 | $0 | $0 |
Source: Public Records
Map
Nearby Homes
- 201 Cuivre Ridge Dr
- 331 Cuivre Creek Ct
- 1 Cuivre River Dr
- 175 Rivers Edge Dr
- 179 Rivers Edge Dr
- 155 Rivers Edge Dr
- 45 Shelter Dr
- 317 E 2nd St
- 106 Ridge Rd
- 50 River Rd
- 336 Santa Cruz Dr
- 216 Red Mare Rd
- 116 Grindstone Ct
- 114 Grindstone Ct
- 115 Grindstone Ct
- 117 Grindstone Ct
- 191 Gracie Ln
- 221 Sycamore Creek Dr
- 0 6 76+ -Acres 41 Walter Ct Unit MIS26012968
- 0 1 89+ -Acres 41 Walter Ct Unit MIS26012970
- 787 Creech School Rd
- 835 Creech School Rd
- 855 Creech School Rd
- 4 Bluff Haven Dr
- 3 Bluff Haven Dr
- 19 Bluff Haven Dr
- 12 Bluff Haven Dr
- 8 Bluff Haven Dr
- 320 Gravens Rd
- 16 Bluff Haven Dr
- 893 Creech School Rd
- 20 Bluff Haven Dr
- 24 Bluff Haven Dr
- 0 Creech School Unit 10007562
- 0 Creech School Unit 11018619
- 985 Creech School Rd
- 921 Creech School Rd
- 42 Cattail Place
- 348 Gravens Rd
- 930 Creech School Rd
Your Personal Tour Guide
Ask me questions while you tour the home.