Estimated Value: $98,395 - $188,000
--
Bed
1
Bath
1,503
Sq Ft
$109/Sq Ft
Est. Value
About This Home
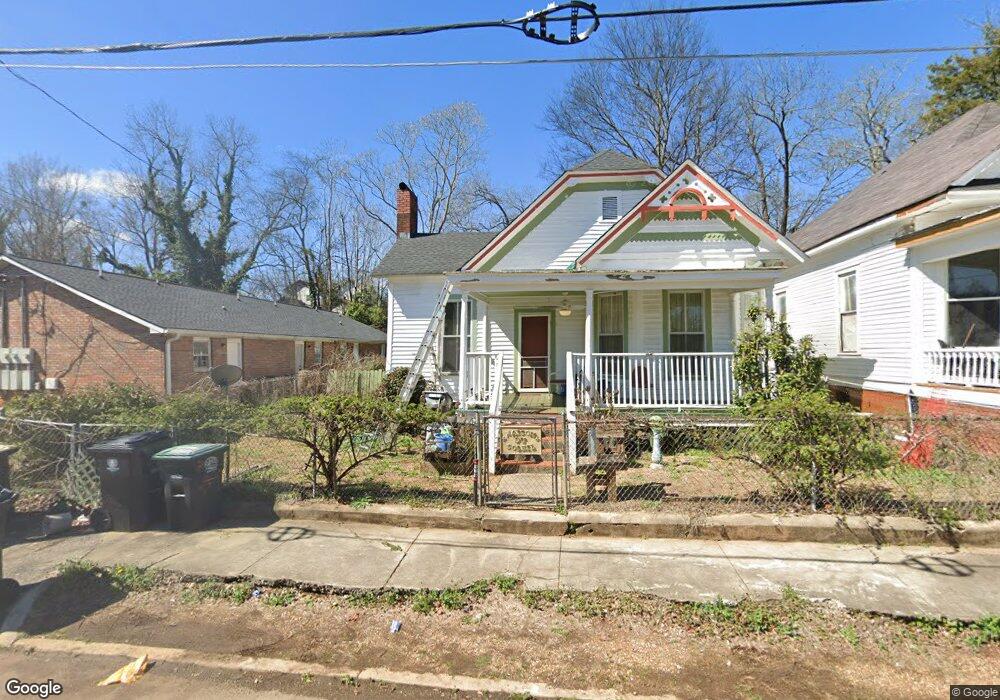
This home is located at 802 Darlington Way SW, Rome, GA 30161 and is currently estimated at $164,099, approximately $109 per square foot. 802 Darlington Way SW is a home located in Floyd County with nearby schools including Dan McCarty Middle School, Rome High School, and St. Mary School.
Ownership History
Date
Name
Owned For
Owner Type
Purchase Details
Closed on
May 25, 2001
Sold by
Lovett Warren
Bought by
Ballenger Ballenger H and Ballenger M
Current Estimated Value
Purchase Details
Closed on
Aug 2, 1994
Sold by
Foster Danny L
Bought by
Lovett Warren
Purchase Details
Closed on
Mar 22, 1994
Sold by
Worley Charles H
Bought by
Foster Danny L
Purchase Details
Closed on
Jul 27, 1988
Sold by
Lewis Terry D and Lewis Nancy J
Bought by
Worley Charles H
Purchase Details
Closed on
Jun 25, 1985
Sold by
Worley Charles H
Bought by
Lewis Terry D and Lewis Nancy J
Purchase Details
Closed on
Jun 26, 1984
Sold by
Pressley Ronnie J
Bought by
Worley Charles H
Purchase Details
Closed on
Aug 21, 1978
Sold by
Doolin Phillip W and Doolin Emily J
Bought by
Pressley Ronnie J
Purchase Details
Closed on
Oct 18, 1977
Sold by
Chapman C L Mrs
Bought by
Doolin Phillip W and Doolin Emily J
Purchase Details
Closed on
Mar 27, 1954
Bought by
Chapman C L Mrs
Create a Home Valuation Report for This Property
The Home Valuation Report is an in-depth analysis detailing your home's value as well as a comparison with similar homes in the area
Home Values in the Area
Average Home Value in this Area
Purchase History
| Date | Buyer | Sale Price | Title Company |
|---|---|---|---|
| Ballenger Ballenger H | $27,500 | -- | |
| Lovett Warren | -- | -- | |
| Foster Danny L | -- | -- | |
| Worley Charles H | -- | -- | |
| Lewis Terry D | $152,300 | -- | |
| Worley Charles H | $5,700 | -- | |
| Pressley Ronnie J | $10,000 | -- | |
| Doolin Phillip W | -- | -- | |
| Chapman C L Mrs | -- | -- |
Source: Public Records
Tax History Compared to Growth
Tax History
| Year | Tax Paid | Tax Assessment Tax Assessment Total Assessment is a certain percentage of the fair market value that is determined by local assessors to be the total taxable value of land and additions on the property. | Land | Improvement |
|---|---|---|---|---|
| 2024 | $229 | $27,311 | $4,269 | $23,042 |
| 2023 | $226 | $25,897 | $3,881 | $22,016 |
| 2022 | $597 | $21,135 | $3,105 | $18,030 |
| 2021 | $571 | $19,134 | $3,105 | $16,029 |
| 2020 | $546 | $17,462 | $2,426 | $15,036 |
| 2019 | $525 | $16,470 | $2,426 | $14,044 |
| 2018 | $501 | $15,141 | $2,426 | $12,715 |
| 2017 | $491 | $14,570 | $2,426 | $12,144 |
| 2016 | $526 | $14,161 | $2,400 | $11,761 |
| 2015 | $497 | $14,161 | $2,400 | $11,761 |
| 2014 | $497 | $14,161 | $2,400 | $11,761 |
Source: Public Records
Map
Nearby Homes
- 800 Darlington Way SW
- 804 Darlington Way SW
- 4 E 8th St SW
- 6 E 8th St SW
- 805 Maple Ave SW
- 808 Darlington Way SW
- 803 Maple Ave SW
- 807 Maple Ave SW
- 809 Maple Ave SW
- 810 Darlington Way SW
- 816 Darlington Way SW
- 812 Darlington Way SW
- 5 E 8th St SW
- 813 Maple Ave SW
- 7 E 8th St SW
- 818 Darlington Way SW
- 820 Darlington Way SW
- 817 Maple Ave SW
- 804 Maple Ave SW
- 105 E 9th St SE