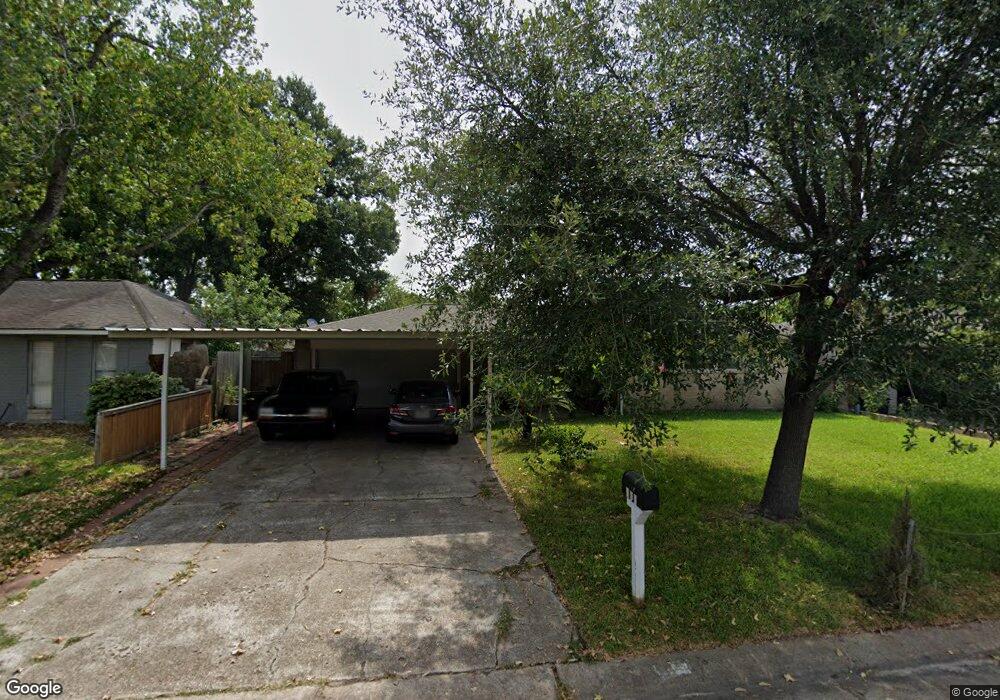
802 Donfield St Channelview, TX 77530
Estimated Value: $180,000 - $202,000
3
Beds
2
Baths
1,099
Sq Ft
$173/Sq Ft
Est. Value
About This Home
This home is located at 802 Donfield St, Channelview, TX 77530 and is currently estimated at $190,114, approximately $172 per square foot. 802 Donfield St is a home located in Harris County with nearby schools including Channelview High School, Family Christian Academy, and Creative Corner.
Ownership History
Date
Name
Owned For
Owner Type
Purchase Details
Closed on
Jul 21, 2020
Sold by
Jackson John E
Bought by
Melendez Marvi
Current Estimated Value
Purchase Details
Closed on
May 29, 1996
Sold by
James Olive and James Horace
Bought by
Melendez Tarzo A and Melendez Emilia
Home Financials for this Owner
Home Financials are based on the most recent Mortgage that was taken out on this home.
Original Mortgage
$50,440
Interest Rate
8.27%
Purchase Details
Closed on
Mar 10, 1995
Sold by
Federal Deposit Insurance Corporation
Bought by
James Olive A
Purchase Details
Closed on
Aug 1, 1994
Sold by
Chevron Usa Inc
Bought by
James Horace Darnley
Purchase Details
Closed on
May 26, 1994
Sold by
James Horace
Bought by
James Olive
Create a Home Valuation Report for This Property
The Home Valuation Report is an in-depth analysis detailing your home's value as well as a comparison with similar homes in the area
Home Values in the Area
Average Home Value in this Area
Purchase History
| Date | Buyer | Sale Price | Title Company |
|---|---|---|---|
| Melendez Marvi | -- | South Land Title Llc | |
| Melendez Tarzo A | -- | -- | |
| Melendez Tarzo A | -- | -- | |
| James Olive A | -- | Houston Title Company 613 | |
| James Horace Darnley | -- | -- | |
| James Olive | -- | -- |
Source: Public Records
Mortgage History
| Date | Status | Borrower | Loan Amount |
|---|---|---|---|
| Previous Owner | Melendez Tarzo A | $50,440 |
Source: Public Records
Tax History Compared to Growth
Tax History
| Year | Tax Paid | Tax Assessment Tax Assessment Total Assessment is a certain percentage of the fair market value that is determined by local assessors to be the total taxable value of land and additions on the property. | Land | Improvement |
|---|---|---|---|---|
| 2025 | $437 | $168,988 | $34,504 | $134,484 |
| 2024 | $437 | $168,988 | $34,504 | $134,484 |
| 2023 | $437 | $179,884 | $34,504 | $145,380 |
| 2022 | $3,545 | $152,202 | $34,504 | $117,698 |
| 2021 | $3,364 | $129,361 | $34,504 | $94,857 |
| 2020 | $3,262 | $114,602 | $31,478 | $83,124 |
| 2019 | $3,051 | $113,010 | $31,478 | $81,532 |
| 2018 | $578 | $93,858 | $24,214 | $69,644 |
| 2017 | $2,532 | $93,858 | $24,214 | $69,644 |
| 2016 | $2,302 | $81,251 | $24,214 | $57,037 |
| 2015 | $1,067 | $68,786 | $14,831 | $53,955 |
| 2014 | $1,067 | $59,673 | $14,831 | $44,842 |
Source: Public Records
Map
Nearby Homes
- 730 Doncrest St
- 814 Deercrest St
- 727 Doncrest St
- 707 Doncrest St
- 827 Dondell St
- 730 Stonyridge St
- 707 Terryhollow St
- 830 Stonyridge St
- 15014 Groveshire St
- 714 Ivy Hollow St
- 15122 Sheffield Terrace
- 826 Ivy Hollow St
- 726 Brookview St
- 722 Canna St
- 15225 Woodforest Blvd
- 1034 Littleport Ln
- 743 Knob Hollow St
- 634 Bright Penny Ln
- 910 Calm Creek Ct
- 14902 Woodford St
- 806 Donfield St
- 730 Donfield St
- 755 Deercrest St
- 803 Deercrest St
- 810 Donfield St
- 726 Donfield St
- 751 Deercrest St
- 807 Deercrest St
- 803 Donfield St
- 747 Deercrest St
- 731 Donfield St
- 814 Donfield St
- 807 Donfield St
- 722 Donfield St
- 727 Donfield St
- 811 Deercrest St
- 811 Donfield St
- 743 Deercrest St
- 723 Donfield St
- 818 Donfield St