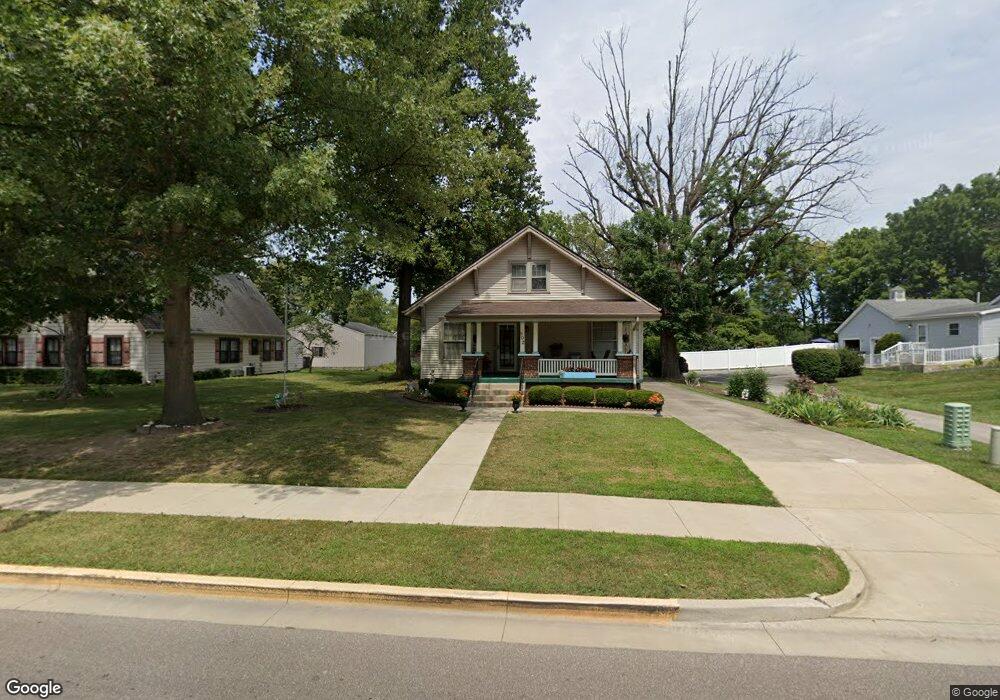
802 E Main Cross St Edinburgh, IN 46124
Estimated Value: $229,000 - $280,000
2
Beds
1
Bath
1,500
Sq Ft
$167/Sq Ft
Est. Value
About This Home
This home is located at 802 E Main Cross St, Edinburgh, IN 46124 and is currently estimated at $250,587, approximately $167 per square foot. 802 E Main Cross St is a home located in Johnson County with nearby schools including East Side Elementary School, Edinburgh Community Middle School, and Edinburgh Community High School.
Ownership History
Date
Name
Owned For
Owner Type
Purchase Details
Closed on
Aug 4, 2017
Sold by
Vaughan James T and Vaughan Deborah L
Bought by
Ackerman Robert C and Pruitt Larry E
Current Estimated Value
Home Financials for this Owner
Home Financials are based on the most recent Mortgage that was taken out on this home.
Original Mortgage
$108,007
Outstanding Balance
$91,405
Interest Rate
4.5%
Mortgage Type
FHA
Estimated Equity
$159,182
Purchase Details
Closed on
Jun 6, 2006
Sold by
Couch Raymond and Couch Carrell L
Bought by
Couch Raymond and Couch Carrell L
Create a Home Valuation Report for This Property
The Home Valuation Report is an in-depth analysis detailing your home's value as well as a comparison with similar homes in the area
Home Values in the Area
Average Home Value in this Area
Purchase History
| Date | Buyer | Sale Price | Title Company |
|---|---|---|---|
| Ackerman Robert C | -- | None Available | |
| Couch Raymond | -- | None Available |
Source: Public Records
Mortgage History
| Date | Status | Borrower | Loan Amount |
|---|---|---|---|
| Open | Ackerman Robert C | $108,007 |
Source: Public Records
Tax History
| Year | Tax Paid | Tax Assessment Tax Assessment Total Assessment is a certain percentage of the fair market value that is determined by local assessors to be the total taxable value of land and additions on the property. | Land | Improvement |
|---|---|---|---|---|
| 2025 | $582 | $219,600 | $24,300 | $195,300 |
| 2024 | $582 | $199,300 | $24,600 | $174,700 |
| 2023 | $571 | $180,000 | $24,600 | $155,400 |
| 2022 | $560 | $162,700 | $24,600 | $138,100 |
| 2021 | $549 | $140,900 | $20,000 | $120,900 |
| 2020 | $538 | $125,400 | $18,000 | $107,400 |
| 2019 | $527 | $120,000 | $18,000 | $102,000 |
| 2018 | $731 | $108,200 | $18,000 | $90,200 |
| 2017 | $944 | $94,400 | $18,000 | $76,400 |
| 2016 | $1,884 | $91,400 | $16,200 | $75,200 |
| 2014 | $1,954 | $97,700 | $16,200 | $81,500 |
| 2013 | $1,954 | $88,300 | $17,900 | $70,400 |
Source: Public Records
Map
Nearby Homes
- 110 Lincoln St
- 501 E Thompson St
- 116 Lind Dr
- 400 E Main Cross St
- 502 E Campbell St
- 933 Independence Dr
- 630 Liberty Cir
- 1130 Constitution Dr
- 401 S Walnut St
- 1066 Capitol Dr
- 407 S Pleasant St
- 1050 Capital Dr
- 1056 Capitol Dr
- 1008 Capitol Dr
- 310 S Pleasant St
- 602 S Walnut St
- 7642 S 800 E
- 20 N Eisenhower Dr
- 7221 U S 31 S
- 4404 W Nerna St
- 800 E Main Cross St
- 804 E Main Cross St
- 107 Franklin St
- 0 E Main Cross St
- 1133 E Main Cross St
- Lot 5 E Main Cross St
- Lot 4 E Main Cross St
- 109 Franklin St
- 806 E Main Cross St
- 713 E Main Cross St
- 704 E Main Cross St
- 108 Franklin St
- 711 E Main Cross St
- 801 E Main Cross St
- 709 E Main Cross St
- 803 E Main Cross St
- 707 E Main Cross St
- 201 Franklin St
- 702 E Main Cross St
Your Personal Tour Guide
Ask me questions while you tour the home.