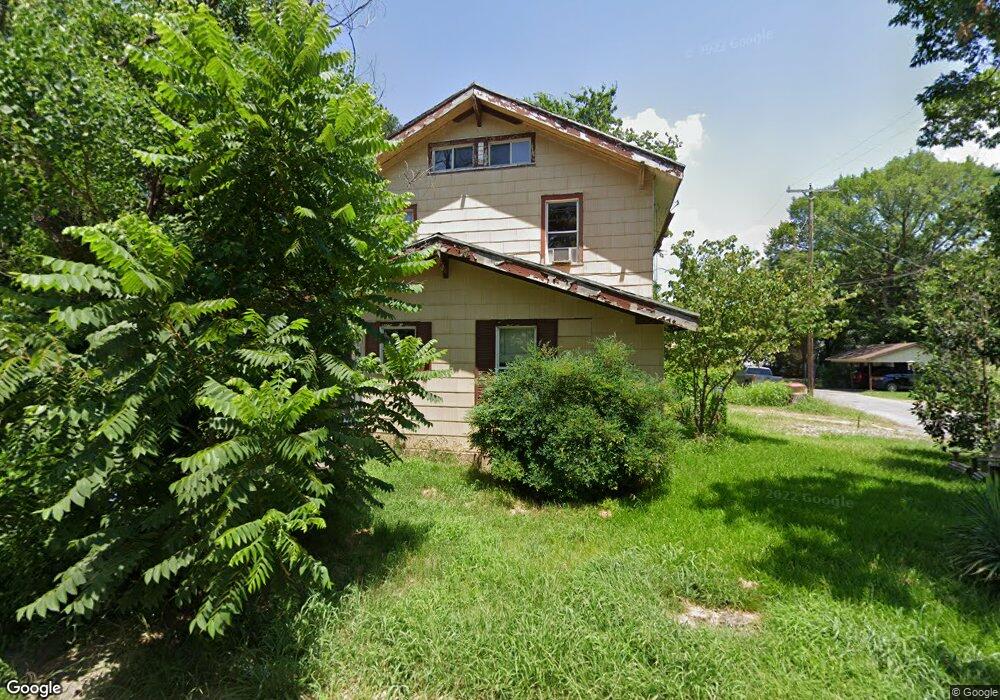
802 Elm St Bonham, TX 75418
Estimated Value: $199,000 - $264,000
Studio
1
Bath
1,794
Sq Ft
$123/Sq Ft
Est. Value
About This Home
This home is located at 802 Elm St, Bonham, TX 75418 and is currently estimated at $220,747, approximately $123 per square foot. 802 Elm St is a home located in Fannin County with nearby schools including Evans Elementary School, Finley-Oates Elementary School, and LH Rather Jr High School.
Ownership History
Date
Name
Owned For
Owner Type
Purchase Details
Closed on
Jul 5, 2024
Sold by
Tinuviel Llc
Bought by
Bartlett John and Bartlett Ashley
Current Estimated Value
Home Financials for this Owner
Home Financials are based on the most recent Mortgage that was taken out on this home.
Original Mortgage
$187,500
Interest Rate
10.99%
Mortgage Type
Construction
Purchase Details
Closed on
May 17, 2024
Sold by
Morris Dennis and Barrett Janet Lea
Bought by
Tinuviel Llc
Home Financials for this Owner
Home Financials are based on the most recent Mortgage that was taken out on this home.
Original Mortgage
$187,500
Interest Rate
10.99%
Mortgage Type
Construction
Create a Home Valuation Report for This Property
The Home Valuation Report is an in-depth analysis detailing your home's value as well as a comparison with similar homes in the area
Purchase History
| Date | Buyer | Sale Price | Title Company |
|---|---|---|---|
| Bartlett John | -- | None Listed On Document | |
| Bartlett John | -- | None Listed On Document | |
| Tinuviel Llc | -- | Main Street Title |
Source: Public Records
Mortgage History
| Date | Status | Borrower | Loan Amount |
|---|---|---|---|
| Previous Owner | Bartlett John | $187,500 |
Source: Public Records
Tax History
| Year | Tax Paid | Tax Assessment Tax Assessment Total Assessment is a certain percentage of the fair market value that is determined by local assessors to be the total taxable value of land and additions on the property. | Land | Improvement |
|---|---|---|---|---|
| 2025 | $3,331 | $171,720 | $41,450 | $130,270 |
| 2024 | $1,819 | $93,770 | $40,410 | $53,360 |
| 2023 | $1,715 | $86,970 | $33,540 | $53,430 |
| 2022 | $1,734 | $78,840 | $23,900 | $54,940 |
| 2021 | $1,451 | $57,410 | $11,820 | $45,590 |
| 2020 | $1,000 | $53,790 | $8,860 | $44,930 |
| 2019 | $945 | $52,150 | $8,690 | $43,460 |
| 2018 | $858 | $42,820 | $8,600 | $34,220 |
| 2017 | $751 | $34,470 | $4,170 | $30,300 |
| 2016 | $683 | $29,860 | $4,170 | $25,690 |
| 2015 | -- | $24,300 | $4,000 | $20,300 |
| 2014 | -- | $23,270 | $3,250 | $20,020 |
Source: Public Records
Map
Nearby Homes
Your Personal Tour Guide
Ask me questions while you tour the home.