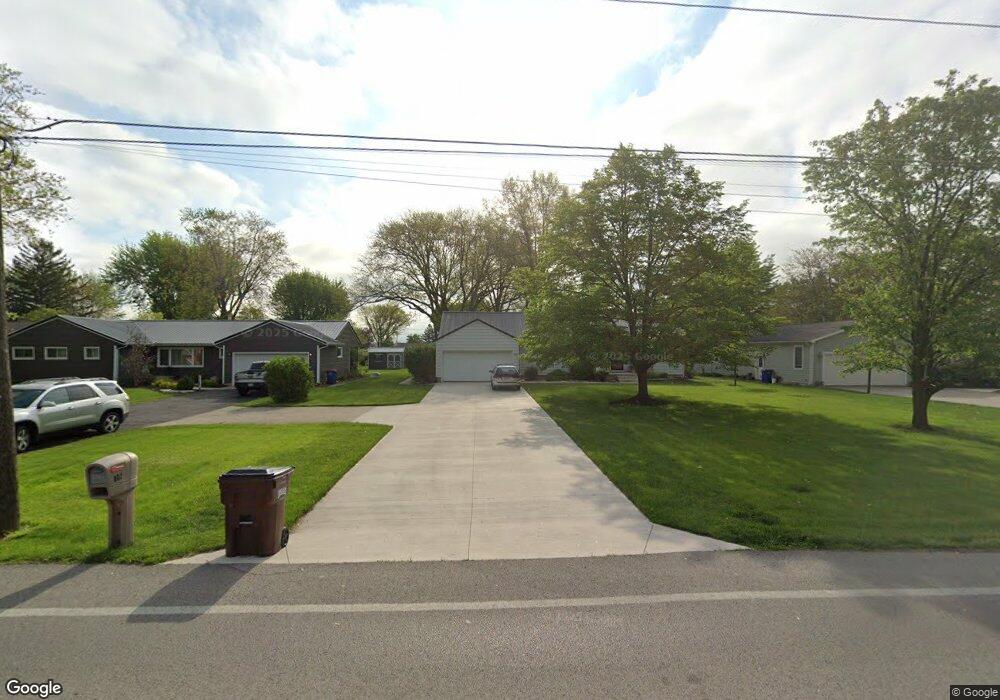
802 Fort Jennings Rd Delphos, OH 45833
Estimated Value: $181,000 - $211,000
3
Beds
2
Baths
1,288
Sq Ft
$156/Sq Ft
Est. Value
About This Home
This home is located at 802 Fort Jennings Rd, Delphos, OH 45833 and is currently estimated at $200,877, approximately $155 per square foot. 802 Fort Jennings Rd is a home located in Allen County with nearby schools including Delphos St. John's High School and Delphos St. John's Elementary School.
Ownership History
Date
Name
Owned For
Owner Type
Purchase Details
Closed on
Aug 5, 2020
Sold by
Kies Ericka E
Bought by
Sheeran John and Sheeran Sue
Current Estimated Value
Purchase Details
Closed on
Jun 12, 2018
Sold by
Kies Ryan P
Bought by
Kies Ericka E
Purchase Details
Closed on
Feb 23, 2013
Sold by
Thoman Elizabeth and Wiesenberg Derek
Bought by
Kies Ryan P and Kies Ericka E
Home Financials for this Owner
Home Financials are based on the most recent Mortgage that was taken out on this home.
Original Mortgage
$75,000
Outstanding Balance
$52,540
Interest Rate
3.38%
Mortgage Type
Purchase Money Mortgage
Estimated Equity
$148,337
Purchase Details
Closed on
Aug 25, 2011
Sold by
Estate Of William Fredrick Wiesenbeg
Bought by
Kies Ericka and Wiesenberg Derek
Purchase Details
Closed on
Dec 3, 2008
Sold by
Wiesenberg William F
Bought by
Wiesenberg William F
Purchase Details
Closed on
Jan 1, 1990
Bought by
Wiesenberg Betty A
Create a Home Valuation Report for This Property
The Home Valuation Report is an in-depth analysis detailing your home's value as well as a comparison with similar homes in the area
Home Values in the Area
Average Home Value in this Area
Purchase History
| Date | Buyer | Sale Price | Title Company |
|---|---|---|---|
| Sheeran John | $145,500 | None Available | |
| Kies Ericka E | -- | None Available | |
| Kies Ryan P | $50,000 | None Available | |
| Kies Ericka | -- | None Available | |
| Wiesenberg William F | -- | Attorney | |
| Wiesenberg Betty A | -- | -- |
Source: Public Records
Mortgage History
| Date | Status | Borrower | Loan Amount |
|---|---|---|---|
| Open | Kies Ryan P | $75,000 |
Source: Public Records
Tax History Compared to Growth
Tax History
| Year | Tax Paid | Tax Assessment Tax Assessment Total Assessment is a certain percentage of the fair market value that is determined by local assessors to be the total taxable value of land and additions on the property. | Land | Improvement |
|---|---|---|---|---|
| 2024 | $1,872 | $59,150 | $12,320 | $46,830 |
| 2023 | $1,642 | $49,290 | $10,260 | $39,030 |
| 2022 | $1,682 | $49,290 | $10,260 | $39,030 |
| 2021 | $1,691 | $49,290 | $10,260 | $39,030 |
| 2020 | $1,254 | $38,190 | $9,700 | $28,490 |
| 2019 | $1,254 | $38,190 | $9,700 | $28,490 |
| 2018 | $1,257 | $38,190 | $9,700 | $28,490 |
| 2017 | $1,231 | $36,900 | $9,700 | $27,200 |
| 2016 | $1,245 | $36,900 | $9,700 | $27,200 |
| 2015 | $1,176 | $36,900 | $9,700 | $27,200 |
| 2014 | $1,176 | $35,560 | $9,310 | $26,250 |
| 2013 | $1,180 | $35,560 | $9,310 | $26,250 |
Source: Public Records
Map
Nearby Homes
- 650 E 6th St
- 914 E 3rd St
- 903 E 3rd St
- 821 E 3rd St
- 628 N Pierce St
- 1303 Carolyn Dr
- 810 N Franklin St
- 1220 Rose Anna Dr
- 704 N Franklin St
- 633 E 2nd St
- 610 N Washington St
- 405 N Franklin St
- 210 E 3rd St
- 221 S Main St
- 503 W 6th St
- 604 W 6th St
- 409 N Bredeick St
- 616 W 5th St
- 424 S Canal St
- 508 S Washington St
- 802 Jennings Rd
- 720 Fort Jennings Rd
- 808 Fort Jennings Rd
- 714 Fort Jennings Rd
- 721 Carolyn Dr
- 803 Carolyn Dr
- 715 Carolyn Dr
- 809 Carolyn Dr
- 725 Fort Jennings Rd
- 719 Fort Jennings Rd
- 826 Fort Jennings Rd
- 708 Fort Jennings Rd
- 829 Fairlane Dr
- 713 Fort Jennings Rd
- 815 Carolyn Dr
- 684 E 7th St
- 821 Carolyn Dr
- 680 E 7th St