Estimated Value: $133,000 - $186,000
3
Beds
2
Baths
1,583
Sq Ft
$103/Sq Ft
Est. Value
About This Home
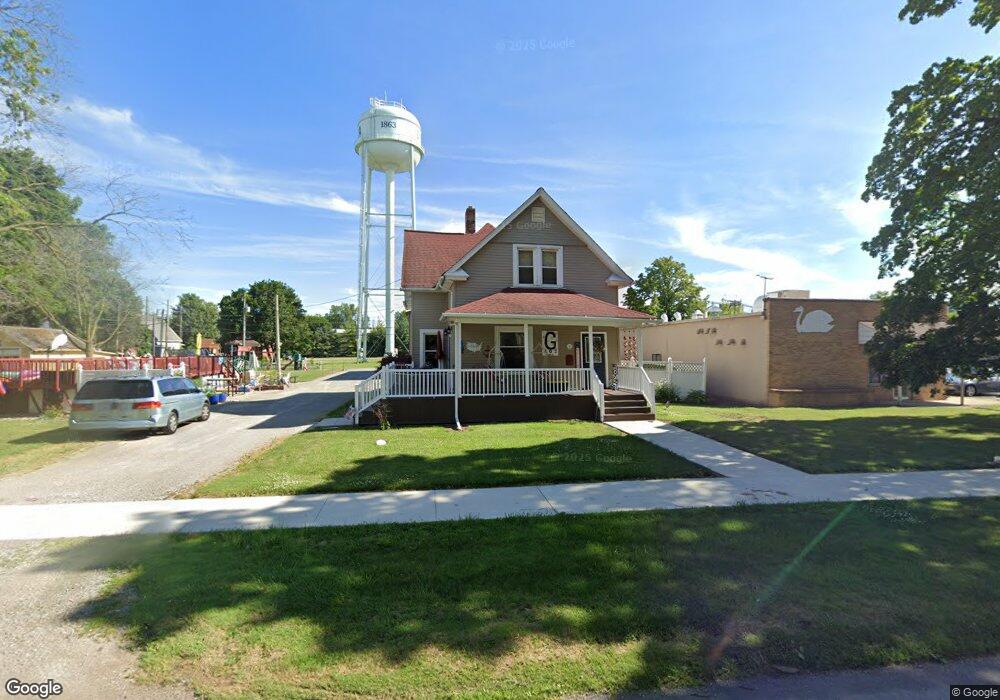
This home is located at 802 Main St, Delta, OH 43515 and is currently estimated at $163,300, approximately $103 per square foot. 802 Main St is a home located in Fulton County with nearby schools including Delta Elementary School, Pike-Delta-York Middle School, and Pike-Delta-York High School.
Ownership History
Date
Name
Owned For
Owner Type
Purchase Details
Closed on
Feb 4, 2000
Sold by
Mcfarland Aaron M
Bought by
Green Richard U and Green Kimberlee S
Current Estimated Value
Home Financials for this Owner
Home Financials are based on the most recent Mortgage that was taken out on this home.
Original Mortgage
$76,400
Outstanding Balance
$24,924
Interest Rate
7.98%
Mortgage Type
New Conventional
Estimated Equity
$138,376
Purchase Details
Closed on
Apr 25, 1995
Sold by
Roloff Walter E
Bought by
Mcfarland Aaron M
Purchase Details
Closed on
Jan 1, 1990
Bought by
Mcfarland Aaron M
Create a Home Valuation Report for This Property
The Home Valuation Report is an in-depth analysis detailing your home's value as well as a comparison with similar homes in the area
Home Values in the Area
Average Home Value in this Area
Purchase History
| Date | Buyer | Sale Price | Title Company |
|---|---|---|---|
| Green Richard U | $84,900 | -- | |
| Mcfarland Aaron M | $58,000 | -- | |
| Mcfarland Aaron M | -- | -- |
Source: Public Records
Mortgage History
| Date | Status | Borrower | Loan Amount |
|---|---|---|---|
| Open | Green Richard U | $76,400 |
Source: Public Records
Tax History Compared to Growth
Tax History
| Year | Tax Paid | Tax Assessment Tax Assessment Total Assessment is a certain percentage of the fair market value that is determined by local assessors to be the total taxable value of land and additions on the property. | Land | Improvement |
|---|---|---|---|---|
| 2024 | $1,972 | $45,430 | $10,850 | $34,580 |
| 2023 | $1,972 | $45,430 | $10,850 | $34,580 |
| 2022 | $2,063 | $36,680 | $9,030 | $27,650 |
| 2021 | $2,095 | $36,680 | $9,030 | $27,650 |
| 2020 | $2,120 | $36,680 | $9,030 | $27,650 |
| 2019 | $2,097 | $37,240 | $9,030 | $28,210 |
| 2018 | $1,074 | $37,240 | $9,030 | $28,210 |
| 2017 | $2,118 | $37,240 | $9,030 | $28,210 |
| 2016 | $1,528 | $26,040 | $9,030 | $17,010 |
| 2015 | $1,465 | $26,040 | $9,030 | $17,010 |
| 2014 | $1,474 | $26,040 | $9,030 | $17,010 |
| 2013 | $1,530 | $27,520 | $7,670 | $19,850 |
Source: Public Records
Map
Nearby Homes
- 701 Palmwood St
- 908 Fernwood St
- 518 Providence St
- 305 Mckinley St
- 413 Fernwood St
- 207 Wood St
- 308 Monroe St
- 810 Greenview Ave
- Integrity 1880 Plan at Oregon Town Center
- Integrity 2060 Plan at Oregon Town Center
- Integrity 2000 Plan at Oregon Town Center
- Elements 2700 Plan at Oregon Town Center
- Integrity 2060 Plan at Hidden Ridge Estates
- integrity 1800 Plan at Hidden Ridge Estates
- Integrity 2061 V8.1a Plan at Hidden Ridge Estates
- Integrity 2060 Plan at Three Meadows North
- Integrity 2080 Plan at Oregon Town Center
- Elements 2390 Plan at Oregon Town Center
- Integrity 2061 V8.1a Plan at Oregon Town Center
- Integrity 1460 Plan at Hidden Ridge Estates