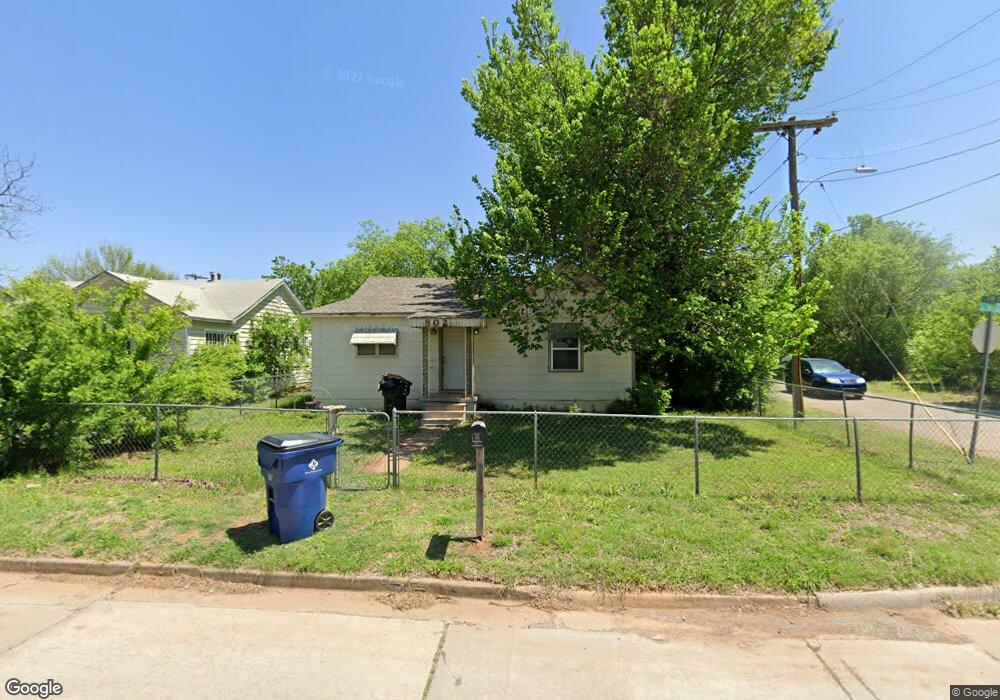
802 N B St Duncan, OK 73533
Estimated Value: $47,000 - $61,000
3
Beds
2
Baths
1,460
Sq Ft
$38/Sq Ft
Est. Value
About This Home
This home is located at 802 N B St, Duncan, OK 73533 and is currently estimated at $55,138, approximately $37 per square foot. 802 N B St is a home located in Stephens County with nearby schools including Woodrow Wilson Elementary School, Duncan Middle School, and Duncan High School.
Ownership History
Date
Name
Owned For
Owner Type
Purchase Details
Closed on
Feb 10, 2014
Sold by
Holland Joshua Lee and Holland Jacinda J
Bought by
Williams Sandra K
Current Estimated Value
Purchase Details
Closed on
Jun 8, 2005
Sold by
Jones Larry D
Bought by
Holland Joshua L and Holland Jacinda J
Home Financials for this Owner
Home Financials are based on the most recent Mortgage that was taken out on this home.
Original Mortgage
$18,700
Interest Rate
5.79%
Mortgage Type
Purchase Money Mortgage
Purchase Details
Closed on
Feb 8, 1999
Sold by
Jones Lawrence A and Jones Ester
Purchase Details
Closed on
Aug 5, 1998
Sold by
Brown Dennis and Brown Annette M
Create a Home Valuation Report for This Property
The Home Valuation Report is an in-depth analysis detailing your home's value as well as a comparison with similar homes in the area
Home Values in the Area
Average Home Value in this Area
Purchase History
| Date | Buyer | Sale Price | Title Company |
|---|---|---|---|
| Williams Sandra K | $30,000 | None Available | |
| Holland Joshua L | $22,000 | Stewart Escrow & Title | |
| -- | -- | -- | |
| -- | $18,400 | -- |
Source: Public Records
Mortgage History
| Date | Status | Borrower | Loan Amount |
|---|---|---|---|
| Previous Owner | Holland Joshua L | $18,700 |
Source: Public Records
Tax History Compared to Growth
Tax History
| Year | Tax Paid | Tax Assessment Tax Assessment Total Assessment is a certain percentage of the fair market value that is determined by local assessors to be the total taxable value of land and additions on the property. | Land | Improvement |
|---|---|---|---|---|
| 2025 | $250 | $3,958 | $356 | $3,602 |
| 2024 | $242 | $3,843 | $356 | $3,487 |
| 2023 | $242 | $3,843 | $356 | $3,487 |
| 2022 | $223 | $3,731 | $356 | $3,375 |
| 2021 | $223 | $3,623 | $356 | $3,267 |
| 2020 | $209 | $3,415 | $356 | $3,059 |
| 2019 | $115 | $3,332 | $356 | $2,976 |
| 2018 | $129 | $3,451 | $356 | $3,095 |
| 2017 | $129 | $3,610 | $356 | $3,254 |
| 2016 | $119 | $3,403 | $356 | $3,047 |
| 2015 | $288 | $3,403 | $356 | $3,047 |
| 2014 | $288 | $3,317 | $440 | $2,877 |
Source: Public Records
Map
Nearby Homes