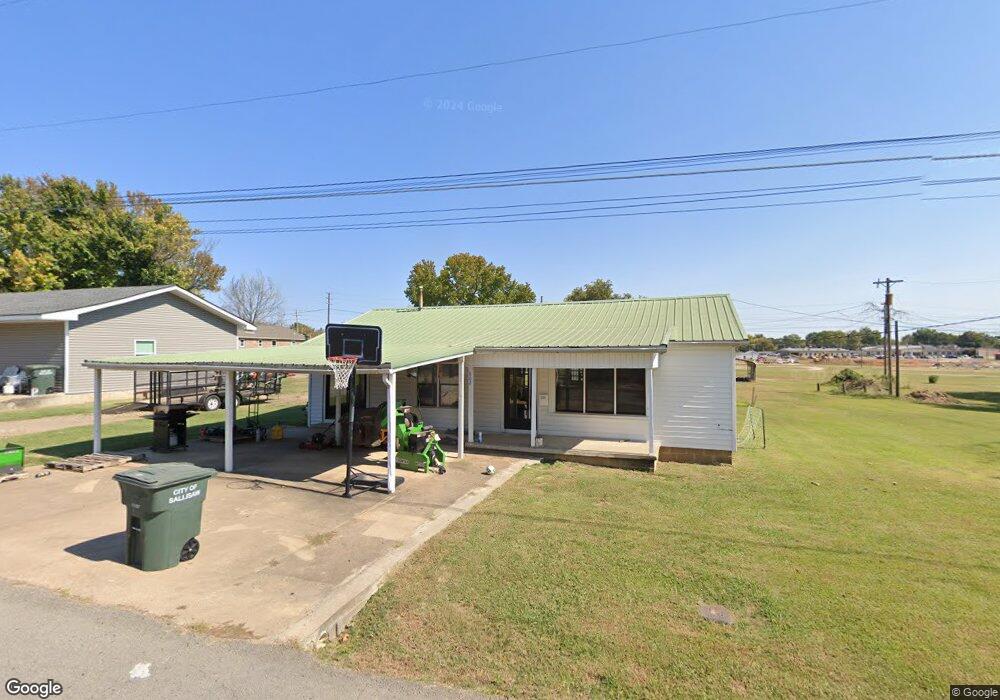
802 N Main St Sallisaw, OK 74955
Estimated Value: $101,000
2
Beds
2
Baths
1,352
Sq Ft
$75/Sq Ft
Est. Value
About This Home
This home is located at 802 N Main St, Sallisaw, OK 74955 and is currently estimated at $101,000, approximately $74 per square foot. 802 N Main St is a home located in Sequoyah County with nearby schools including Liberty Elementary School, Eastside Elementary School, and Sallisaw Middle School.
Ownership History
Date
Name
Owned For
Owner Type
Purchase Details
Closed on
Oct 26, 2023
Sold by
Sanders Richard Dewayne and Sanders Kacy
Bought by
Sanders Richard Dewayne and Sanders Kacy
Current Estimated Value
Purchase Details
Closed on
Feb 23, 2023
Sold by
Farmer Janet Marie and Farmer Stephen J
Bought by
Sanders Richard Dewayne and Sanders Kacy
Home Financials for this Owner
Home Financials are based on the most recent Mortgage that was taken out on this home.
Original Mortgage
$56,000
Interest Rate
6.33%
Mortgage Type
Credit Line Revolving
Purchase Details
Closed on
Apr 4, 2019
Sold by
Rogers Annabell
Bought by
Farmer Janet Marie and Farmer Kimberly Dawn
Purchase Details
Closed on
Jun 30, 2006
Sold by
Farmer Janet Marie and Farmer Stephen
Bought by
Rogers Garlen W and Rogers Annabell
Purchase Details
Closed on
Jul 6, 1989
Sold by
Rogers Garlen W and Rogers Annabell
Bought by
Farmer Janet Marie
Create a Home Valuation Report for This Property
The Home Valuation Report is an in-depth analysis detailing your home's value as well as a comparison with similar homes in the area
Home Values in the Area
Average Home Value in this Area
Purchase History
| Date | Buyer | Sale Price | Title Company |
|---|---|---|---|
| Sanders Richard Dewayne | -- | None Listed On Document | |
| Sanders Richard Dewayne | -- | None Listed On Document | |
| Sanders Richard Dewayne | $70,000 | Valley Land Title | |
| Sanders Richard Dewayne | $70,000 | Valley Land Title | |
| Farmer Janet Marie | -- | Valley Land Title | |
| Farmer Janet Marie | -- | Valley Land Title | |
| Rogers Garlen W | -- | None Available | |
| Farmer Janet Marie | -- | None Available |
Source: Public Records
Mortgage History
| Date | Status | Borrower | Loan Amount |
|---|---|---|---|
| Previous Owner | Sanders Richard Dewayne | $56,000 |
Source: Public Records
Tax History Compared to Growth
Tax History
| Year | Tax Paid | Tax Assessment Tax Assessment Total Assessment is a certain percentage of the fair market value that is determined by local assessors to be the total taxable value of land and additions on the property. | Land | Improvement |
|---|---|---|---|---|
| 2023 | $108 | $3,273 | $1,522 | $1,751 |
| 2022 | $109 | $3,273 | $1,547 | $1,726 |
| 2021 | $108 | $3,273 | $1,547 | $1,726 |
| 2020 | $110 | $3,273 | $1,547 | $1,726 |
| 2019 | $112 | $3,274 | $662 | $2,612 |
| 2018 | $79 | $2,895 | $662 | $2,233 |
| 2017 | $0 | $1,980 | $1,980 | $0 |
| 2016 | $0 | $1,980 | $1,980 | $0 |
| 2015 | -- | $1,980 | $1,980 | $0 |
| 2014 | $98 | $3,081 | $662 | $2,419 |
Source: Public Records
Map
Nearby Homes
- 403 W Argyle Ave
- 204 W Denton Ave
- TBD E 1070 Rd
- 310 W Denton Ave
- 605 N Maple St
- 428 N Elm St
- 403 N Maple St
- 1121 N Maple St
- 401 N Ash St
- 610 N Hickory St
- 404 N Washington St
- 0 Rural Route Unit 2535327
- 218 W Chickasaw Ave
- 412 Ridge Dr
- 891 W Choctaw Ave
- 409 E Choctaw Ave
- 808 W Chickasaw Ave
- 814 W Chickasaw Ave
- 204 S Mulberry St
- 322 S Locust St