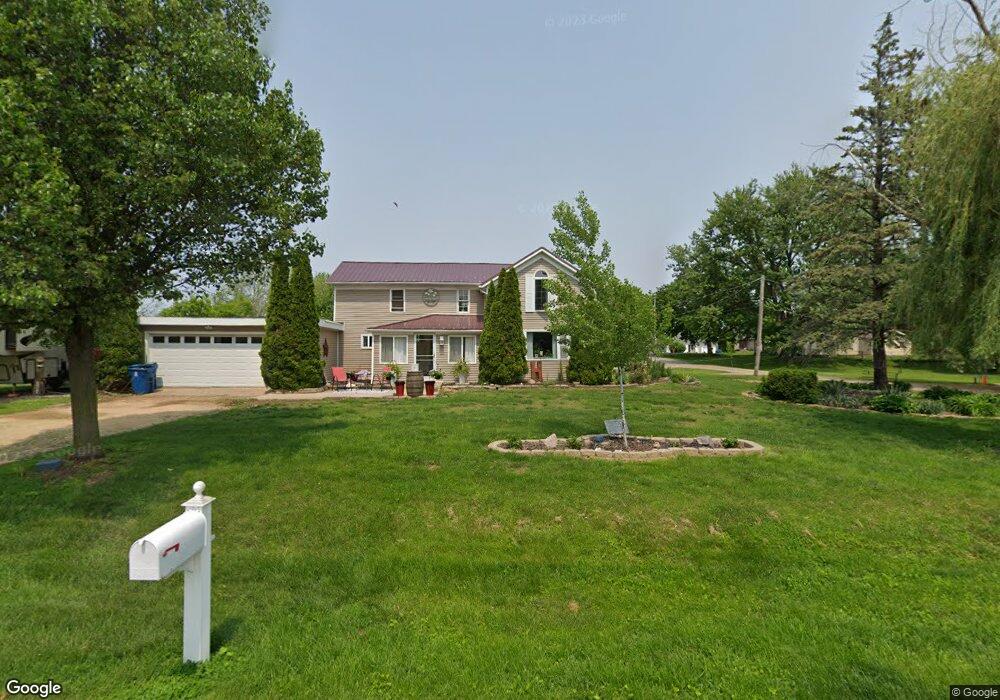
802 S Bluff St Albany, IL 61230
Estimated Value: $147,000 - $184,000
3
Beds
1
Bath
1,392
Sq Ft
$114/Sq Ft
Est. Value
About This Home
This home is located at 802 S Bluff St, Albany, IL 61230 and is currently estimated at $158,102, approximately $113 per square foot. 802 S Bluff St is a home located in Whiteside County with nearby schools including Fulton Elementary School, River Bend Middle School, and Fulton High School.
Create a Home Valuation Report for This Property
The Home Valuation Report is an in-depth analysis detailing your home's value as well as a comparison with similar homes in the area
Home Values in the Area
Average Home Value in this Area
Tax History Compared to Growth
Tax History
| Year | Tax Paid | Tax Assessment Tax Assessment Total Assessment is a certain percentage of the fair market value that is determined by local assessors to be the total taxable value of land and additions on the property. | Land | Improvement |
|---|---|---|---|---|
| 2024 | $2,855 | $40,397 | $4,230 | $36,167 |
| 2023 | $2,606 | $37,401 | $3,916 | $33,485 |
| 2022 | $2,416 | $34,184 | $3,579 | $30,605 |
| 2021 | $2,299 | $32,485 | $3,401 | $29,084 |
| 2020 | $2,288 | $32,333 | $3,385 | $28,948 |
| 2019 | $2,334 | $32,610 | $3,414 | $29,196 |
| 2018 | $2,276 | $32,167 | $3,368 | $28,799 |
| 2017 | $2,179 | $30,670 | $3,211 | $27,459 |
| 2016 | $2,031 | $28,823 | $3,018 | $25,805 |
| 2015 | $1,898 | $28,085 | $2,941 | $25,144 |
| 2014 | $1,842 | $27,200 | $2,848 | $24,352 |
| 2013 | $1,898 | $28,085 | $2,941 | $25,144 |
Source: Public Records
Map
Nearby Homes
- 808 S Church St
- 1006 S Church St
- 507 S Church St
- 0 5th Ave S
- 407 1st Ave
- 913 2nd Ave N
- 205 Pheasant Ridge Dr
- 301 N Church St
- 508 N Bluff St
- 206 9th Ave N
- Lot 110 Garrett Ave
- Lot 114 Garrett Ave
- Lot 111 Garrett Ave
- Lot 112 Garrett Ave
- Lot 113 Garrett Ave
- 111 7th St
- 607 2nd St
- 616 4th Ave
- 711 3rd Ave
- 905 1st St
- 306 8th Ave S
- 306 8th Ave
- 806 S Bluff St
- 801 S Bluff St
- 803 S Bluff St
- 801 S Church St
- 809 S Church St
- 307 8th Ave
- 209 9th Ave S
- 707 S Church St
- 0 9th-South Unit 11646
- 0 9th-South Unit 12577
- 0 9th-South Unit 15414
- 9 South
- 308 9th Ave S
- 901 S Church St
- 9 9th Ave S
- 0 9th Ave S
- 704 Ridge St
- 901 S Bluff St