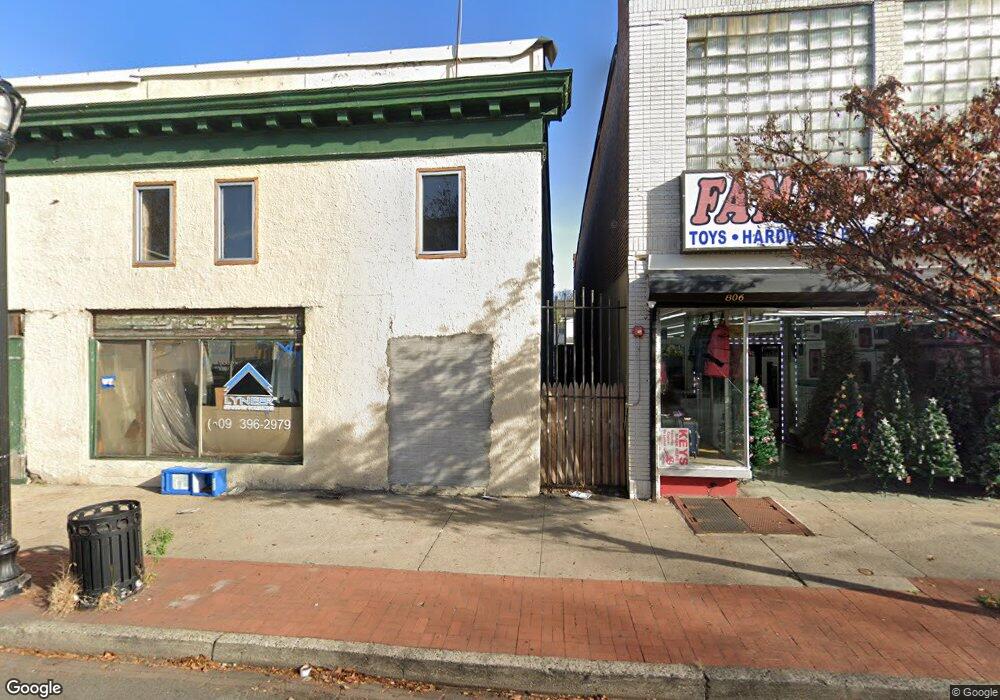
802 S Broad St Unit FRONT Trenton, NJ 08611
Chambersburg Neighborhood
--
Bed
--
Bath
8,864
Sq Ft
4,792
Sq Ft Lot
About This Home
This home is located at 802 S Broad St Unit FRONT, Trenton, NJ 08611. 802 S Broad St Unit FRONT is a home located in Mercer County with nearby schools including Robbins Elementary School, Monument Elementary School, and Dr. Crosby Copeland Elementary School.
Ownership History
Date
Name
Owned For
Owner Type
Purchase Details
Closed on
Feb 12, 2015
Sold by
Misi Lp
Bought by
J A N Properties Llc
Home Financials for this Owner
Home Financials are based on the most recent Mortgage that was taken out on this home.
Original Mortgage
$90,000
Outstanding Balance
$68,475
Interest Rate
3.66%
Mortgage Type
Commercial
Purchase Details
Closed on
Oct 31, 2013
Sold by
Jdsi Lp
Bought by
Misi Lp
Home Financials for this Owner
Home Financials are based on the most recent Mortgage that was taken out on this home.
Original Mortgage
$110,000
Interest Rate
4.35%
Mortgage Type
Commercial
Purchase Details
Closed on
Nov 5, 2012
Sold by
Royal Tax Lien Services Llc
Bought by
Jdsi Lp
Purchase Details
Closed on
Aug 9, 2012
Sold by
Bank New York Mellon and Bierman Lynn
Bought by
Crusader Lien Services and Royal Tax Lien Services
Home Financials for this Owner
Home Financials are based on the most recent Mortgage that was taken out on this home.
Interest Rate
3.59%
Create a Home Valuation Report for This Property
The Home Valuation Report is an in-depth analysis detailing your home's value as well as a comparison with similar homes in the area
Home Values in the Area
Average Home Value in this Area
Purchase History
| Date | Buyer | Sale Price | Title Company |
|---|---|---|---|
| J A N Properties Llc | $150,000 | None Available | |
| Misi Lp | $140,000 | None Available | |
| Jdsi Lp | $80,000 | None Available | |
| Crusader Lien Services | -- | -- |
Source: Public Records
Mortgage History
| Date | Status | Borrower | Loan Amount |
|---|---|---|---|
| Open | J A N Properties Llc | $90,000 | |
| Previous Owner | Misi Lp | $110,000 | |
| Previous Owner | Crusader Lien Services | -- |
Source: Public Records
Tax History Compared to Growth
Tax History
| Year | Tax Paid | Tax Assessment Tax Assessment Total Assessment is a certain percentage of the fair market value that is determined by local assessors to be the total taxable value of land and additions on the property. | Land | Improvement |
|---|---|---|---|---|
| 2025 | $11,300 | $194,800 | $85,500 | $109,300 |
| 2024 | $10,845 | $194,800 | $85,500 | $109,300 |
| 2023 | $10,845 | $194,800 | $85,500 | $109,300 |
| 2022 | $10,632 | $194,800 | $85,500 | $109,300 |
| 2021 | $10,817 | $194,800 | $85,500 | $109,300 |
| 2020 | $10,782 | $194,800 | $85,500 | $109,300 |
| 2019 | $10,609 | $194,800 | $85,500 | $109,300 |
| 2018 | $13,465 | $258,300 | $85,500 | $172,800 |
| 2017 | $12,799 | $258,300 | $85,500 | $172,800 |
| 2016 | $10,258 | $178,300 | $60,000 | $118,300 |
| 2015 | $10,222 | $178,300 | $60,000 | $118,300 |
| 2014 | $10,174 | $178,300 | $60,000 | $118,300 |
Source: Public Records
Map
Nearby Homes
- 802 S Broad St
- 808 S Broad St
- 730 S Broad St
- 201 Genesee St
- 203 Genesee St
- 205 Genesee St
- 207 Genesee St
- 805 S Broad St
- 724 S Broad St
- 209 Genesee St
- 801 S Broad St
- 803 S Broad St
- 211 Genesee St
- 729 S Broad St
- 137 Genesee St
- 139 Genesee St
- 813 S Broad St
- 725-729 S Broad St
- 811 S Broad St
- 135 Genesee St