
Seller's Agent in 2025
Craig Wainwright
Wainwright Realty
(309) 236-8523
29 in this area
117 Total Sales

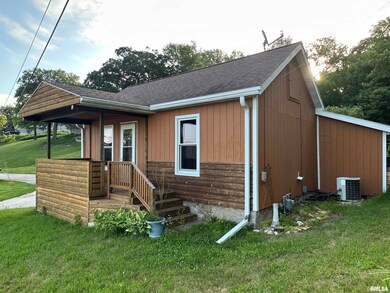
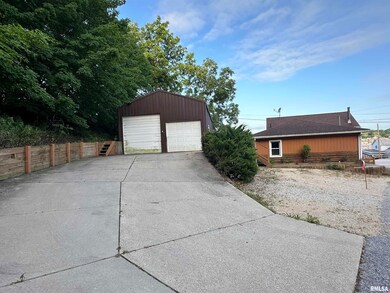
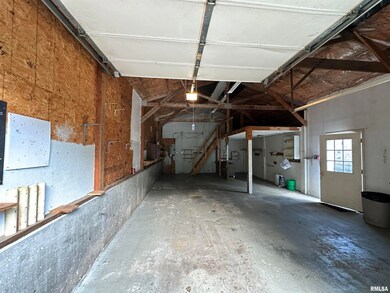
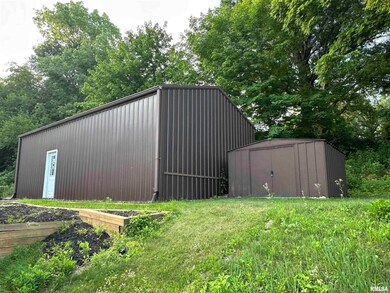
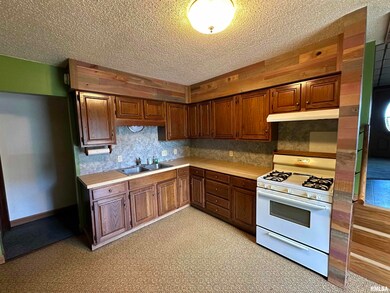
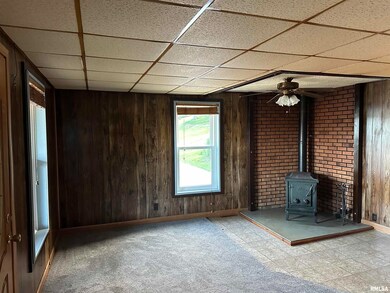
MISSISSIPPI RIVER view. Simple and adequate describes this home best. Living room has woodburning stove. New stackable washer /dryer. Oversized garage 20' X 36'. Sale is "Subject To" lot line corrections by executor. Covered porch extends on to Rt. 84 Right of Way.
Last Agent to Sell the Property
Wainwright Realty Brokerage Phone: 309-523-3338 License #471.006013/B59424000 Listed on: 07/18/2025
Last Buyer's Agent
Wainwright Realty Brokerage Phone: 309-523-3338 License #471.006013/B59424000 Listed on: 07/18/2025
| Date | Type | Sale Price | Title Company |
|---|---|---|---|
| Executors Deed | $130,000 | None Listed On Document | |
| Quit Claim Deed | -- | None Listed On Document |
| Date | Event | Price | List to Sale | Price per Sq Ft |
|---|---|---|---|---|
| 09/05/2025 09/05/25 | Sold | $130,000 | -3.7% | $127 / Sq Ft |
| 08/10/2025 08/10/25 | Pending | -- | -- | -- |
| 07/18/2025 07/18/25 | For Sale | $135,000 | -- | $132 / Sq Ft |
| Year | Tax Paid | Tax Assessment Tax Assessment Total Assessment is a certain percentage of the fair market value that is determined by local assessors to be the total taxable value of land and additions on the property. | Land | Improvement |
|---|---|---|---|---|
| 2024 | $1,097 | $31,169 | $6,119 | $25,050 |
| 2023 | $1,097 | $28,596 | $5,614 | $22,982 |
| 2022 | $1,139 | $27,273 | $5,354 | $21,919 |
| 2021 | $1,175 | $25,851 | $5,075 | $20,776 |
| 2020 | $158 | $25,469 | $5,000 | $20,469 |
| 2019 | $1,586 | $25,469 | $5,000 | $20,469 |
| 2018 | $1,557 | $25,460 | $4,866 | $20,594 |
| 2017 | $1,534 | $25,460 | $4,866 | $20,594 |
| 2016 | $1,514 | $25,109 | $4,799 | $20,310 |
| 2015 | $1,435 | $23,946 | $4,576 | $19,370 |
| 2014 | $309 | $23,476 | $4,486 | $18,990 |
| 2013 | $309 | $23,476 | $4,486 | $18,990 |
Seller's Agent in 2025
Craig Wainwright
Wainwright Realty
(309) 236-8523
29 in this area
117 Total Sales
Source: RMLS Alliance
MLS Number: QC4265502
APN: 04-36-202-013
Disclaimer: Certain information contained herein is derived from information provided by parties other than Homes.com. All information provided is deemed reliable, but is not guaranteed to be accurate and should be independently verified.
![]() IDX information is provided exclusively for personal, non-commercial use, and may not be used for any purpose other than to identify prospective properties consumers may be interested in purchasing. Information is deemed reliable but not guaranteed.
IDX information is provided exclusively for personal, non-commercial use, and may not be used for any purpose other than to identify prospective properties consumers may be interested in purchasing. Information is deemed reliable but not guaranteed.