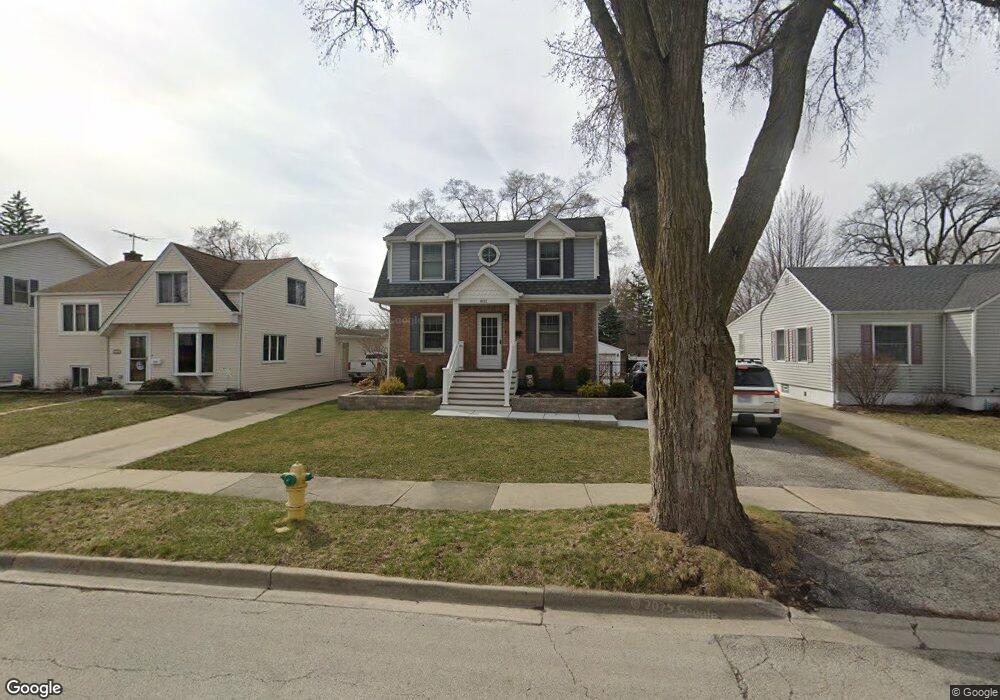
802 S Hillside Ave Elmhurst, IL 60126
Estimated Value: $499,000 - $760,000
Studio
--
Bath
1,844
Sq Ft
$334/Sq Ft
Est. Value
About This Home
This home is located at 802 S Hillside Ave, Elmhurst, IL 60126 and is currently estimated at $615,235, approximately $333 per square foot. 802 S Hillside Ave is a home located in DuPage County with nearby schools including Jackson Elementary School, Bryan Middle School, and York Community High School.
Ownership History
Date
Name
Owned For
Owner Type
Purchase Details
Closed on
Jan 27, 2000
Sold by
Rodgers Paul W and Rodgers Amy M
Bought by
Magner Reid and Tuggle Magner Allison
Current Estimated Value
Home Financials for this Owner
Home Financials are based on the most recent Mortgage that was taken out on this home.
Original Mortgage
$165,600
Outstanding Balance
$52,102
Interest Rate
7.5%
Estimated Equity
$563,133
Purchase Details
Closed on
Aug 8, 1994
Sold by
Frederick Rick L and Frederick Kathryn S
Bought by
Rodgers Paul W and Rodgers Amy M
Home Financials for this Owner
Home Financials are based on the most recent Mortgage that was taken out on this home.
Original Mortgage
$124,800
Interest Rate
8.6%
Create a Home Valuation Report for This Property
The Home Valuation Report is an in-depth analysis detailing your home's value as well as a comparison with similar homes in the area
Home Values in the Area
Average Home Value in this Area
Purchase History
We collect this data history from publicly available records. To have your information removed, we recommend requesting removal directly through your county’s website.
| Date | Buyer | Sale Price | Title Company |
|---|---|---|---|
| Magner Reid | $207,000 | -- | |
| Rodgers Paul W | $139,000 | -- |
Source: Public Records
Mortgage History
We collect this data history from publicly available records. To have your information removed, we recommend requesting removal directly through your county’s website.
| Date | Status | Borrower | Loan Amount |
|---|---|---|---|
| Open | Magner Reid | $165,600 | |
| Previous Owner | Rodgers Paul W | $124,800 | |
| Closed | Magner Reid | $20,700 |
Source: Public Records
Tax History
| Year | Tax Paid | Tax Assessment Tax Assessment Total Assessment is a certain percentage of the fair market value that is determined by local assessors to be the total taxable value of land and additions on the property. | Land | Improvement |
|---|---|---|---|---|
| 2024 | $11,487 | $198,610 | $82,197 | $116,413 |
| 2023 | $10,664 | $183,660 | $76,010 | $107,650 |
| 2022 | $10,436 | $178,110 | $73,080 | $105,030 |
| 2021 | $10,178 | $173,680 | $71,260 | $102,420 |
| 2020 | $9,785 | $169,880 | $69,700 | $100,180 |
| 2019 | $9,580 | $161,520 | $66,270 | $95,250 |
| 2018 | $8,596 | $144,750 | $62,720 | $82,030 |
| 2017 | $8,407 | $137,940 | $59,770 | $78,170 |
| 2016 | $8,228 | $129,950 | $56,310 | $73,640 |
| 2015 | $8,144 | $121,060 | $52,460 | $68,600 |
| 2014 | $10,160 | $137,840 | $41,630 | $96,210 |
| 2013 | $10,050 | $139,790 | $42,220 | $97,570 |
Source: Public Records
Map
Nearby Homes
- 817 S Fairfield Ave
- 816 S Spring Rd
- 797 S Spring Rd
- 817 S Spring Rd
- 850 S Hillside Ave
- 760 S Spring Rd
- 838 S Saylor Ave
- 732 S Hillside Ave
- 868 S Spring Rd
- 742 S Saylor Ave
- 769 S Fairview Ave
- 901 S Hillside Ave
- 923 S Fairfield Ave
- 700 S Swain Ave
- 718 S Fairview Ave
- 663 S Hawthorne Ave
- 769 S Prospect Ave
- 956 S Hillside Ave
- 964 S Hillside Ave
- 630 S Hillside Ave
- 796 S Hillside Ave
- 806 S Hillside Ave
- 794 S Hillside Ave
- 810 S Hillside Ave
- 803 S Fairfield Ave
- 814 S Hillside Ave
- 790 S Hillside Ave
- 807 S Fairfield Ave
- 801 S Fairfield Ave
- 795 S Fairfield Ave
- 801 S Hillside Ave
- 791 S Fairfield Ave
- 811 S Fairfield Ave
- 786 S Hillside Ave
- 803 S Hillside Ave
- 795 S Hillside Ave
- 818 S Hillside Ave
- 807 S Hillside Ave
- 789 S Fairfield Ave
- 791 S Hillside Ave
Your Personal Tour Guide
Ask me questions while you tour the home.