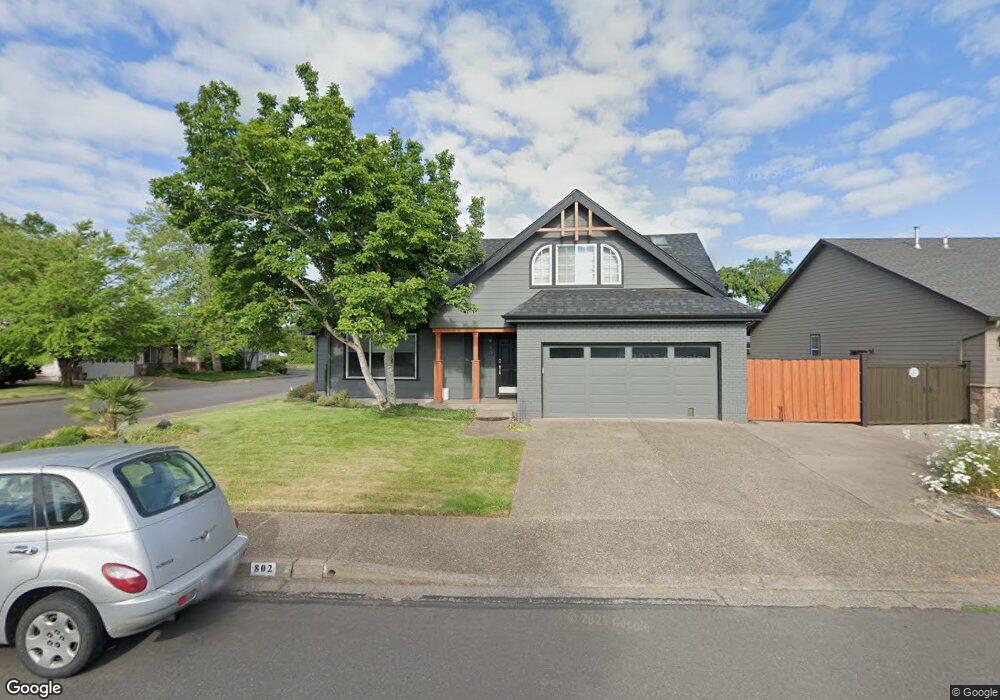
802 Sheraton Dr Eugene, OR 97401
Harlow NeighborhoodEstimated Value: $429,000 - $560,000
3
Beds
3
Baths
2,063
Sq Ft
$251/Sq Ft
Est. Value
About This Home
This home is located at 802 Sheraton Dr, Eugene, OR 97401 and is currently estimated at $517,493, approximately $250 per square foot. 802 Sheraton Dr is a home located in Lane County with nearby schools including Holt Elementary School, Monroe Middle School, and Sheldon High School.
Ownership History
Date
Name
Owned For
Owner Type
Purchase Details
Closed on
Sep 24, 2009
Sold by
Svendsen Glen L and Svendsen Glen Lee
Bought by
Beck Jeffrey R
Current Estimated Value
Home Financials for this Owner
Home Financials are based on the most recent Mortgage that was taken out on this home.
Original Mortgage
$260,200
Outstanding Balance
$169,998
Interest Rate
5.25%
Mortgage Type
FHA
Estimated Equity
$347,495
Purchase Details
Closed on
Jun 15, 2007
Sold by
Crenshaw Sheila Rae
Bought by
Svendsen Glen Lee
Create a Home Valuation Report for This Property
The Home Valuation Report is an in-depth analysis detailing your home's value as well as a comparison with similar homes in the area
Home Values in the Area
Average Home Value in this Area
Purchase History
| Date | Buyer | Sale Price | Title Company |
|---|---|---|---|
| Beck Jeffrey R | $265,000 | First American Title | |
| Svendsen Glen Lee | -- | None Available |
Source: Public Records
Mortgage History
| Date | Status | Borrower | Loan Amount |
|---|---|---|---|
| Open | Beck Jeffrey R | $260,200 |
Source: Public Records
Tax History
| Year | Tax Paid | Tax Assessment Tax Assessment Total Assessment is a certain percentage of the fair market value that is determined by local assessors to be the total taxable value of land and additions on the property. | Land | Improvement |
|---|---|---|---|---|
| 2025 | $6,191 | $317,762 | -- | -- |
| 2024 | $6,114 | $308,507 | -- | -- |
| 2023 | $6,114 | $299,522 | $0 | $0 |
| 2022 | $5,728 | $290,799 | $0 | $0 |
| 2021 | $5,380 | $282,330 | $0 | $0 |
| 2020 | $5,307 | $274,107 | $0 | $0 |
| 2019 | $5,072 | $266,124 | $0 | $0 |
| 2018 | $4,682 | $250,848 | $0 | $0 |
| 2017 | $4,405 | $250,848 | $0 | $0 |
| 2016 | $4,204 | $243,542 | $0 | $0 |
| 2015 | $4,056 | $236,449 | $0 | $0 |
| 2014 | $4,004 | $229,562 | $0 | $0 |
Source: Public Records
Map
Nearby Homes
- 3700 Babcock Ln Unit 119
- 3700 Babcock Ln Unit 106
- 825 Waverly St
- 1271 Arcadia Dr
- 2727 Gateway St Unit 27
- 1491 Victorian Way
- 280 Roan Dr
- 1564 Regency Dr
- 2994 Dapple Way
- 898 Lochaven Ave
- 0 Sprig Ln Unit Lot 3
- 0 Sprig Ln Unit Lot 3 766109892
- 2872 Suffolk Ct
- 1630 Ridgley Blvd
- 650 Harlow Rd Unit 209
- 2746 Harlow Rd
- 1450 W Quinalt St
- 280 Regal Ct
- 1310 W Quinalt St
- 600 Cherry Dr Unit 8
- 822 Sheraton Dr
- 822 Chateau Meadows Dr
- 843 Chateau Meadows Dr
- 803 Sheraton Dr
- 842 Sheraton Dr
- 821 Chateau Meadows Dr
- 865 Chateau Meadows Dr
- 806 Chateau Meadows Dr
- 825 Sheraton Dr
- 805 Chateau Meadows Dr
- 795 Arcadia Dr
- 864 Sheraton Dr
- 877 Chateau Meadows Dr
- 892 Chateau Meadows Dr
- 861 Arcadia Dr
- 805 Chateau Meadowns 795 Arcadia Dr
- 881 Chateau Meadows Dr
- 847 Sheraton Dr
- 775 Arcadia Dr
- 893 Chateau Meadows Dr
Your Personal Tour Guide
Ask me questions while you tour the home.