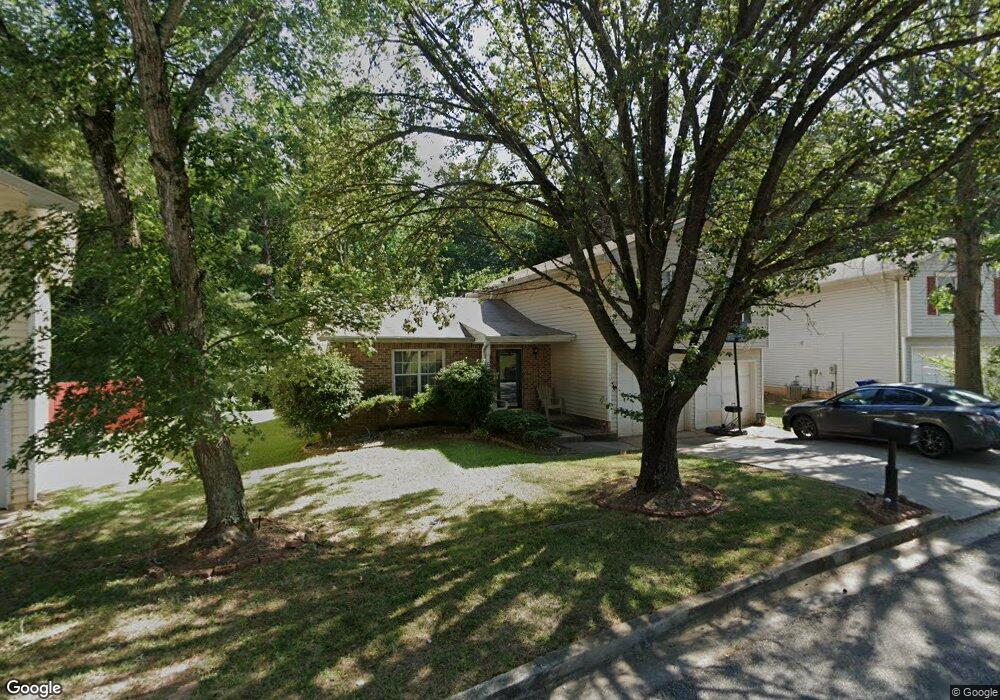
802 Stonebridge Crescent Lithonia, GA 30058
Estimated Value: $237,000 - $265,000
3
Beds
2
Baths
1,633
Sq Ft
$156/Sq Ft
Est. Value
About This Home
This home is located at 802 Stonebridge Crescent, Lithonia, GA 30058 and is currently estimated at $254,861, approximately $156 per square foot. 802 Stonebridge Crescent is a home located in DeKalb County with nearby schools including Rock Chapel Elementary School, Stephenson Middle School, and Stephenson High School.
Ownership History
Date
Name
Owned For
Owner Type
Purchase Details
Closed on
Sep 20, 2001
Sold by
Womack Melvin and Womack Angela
Bought by
Powell Delkia J
Current Estimated Value
Home Financials for this Owner
Home Financials are based on the most recent Mortgage that was taken out on this home.
Original Mortgage
$120,016
Outstanding Balance
$46,390
Interest Rate
6.87%
Mortgage Type
New Conventional
Estimated Equity
$208,471
Purchase Details
Closed on
Feb 28, 2001
Sold by
Miles Barbara A
Bought by
Thomas William C
Home Financials for this Owner
Home Financials are based on the most recent Mortgage that was taken out on this home.
Original Mortgage
$113,600
Interest Rate
7.12%
Mortgage Type
New Conventional
Purchase Details
Closed on
Aug 25, 1994
Sold by
Atwood Prop Inc
Bought by
Womack Melvin E
Home Financials for this Owner
Home Financials are based on the most recent Mortgage that was taken out on this home.
Original Mortgage
$83,900
Interest Rate
8.74%
Mortgage Type
VA
Create a Home Valuation Report for This Property
The Home Valuation Report is an in-depth analysis detailing your home's value as well as a comparison with similar homes in the area
Home Values in the Area
Average Home Value in this Area
Purchase History
| Date | Buyer | Sale Price | Title Company |
|---|---|---|---|
| Powell Delkia J | $121,900 | -- | |
| Thomas William C | $133,700 | -- | |
| Womack Melvin E | $83,900 | -- |
Source: Public Records
Mortgage History
| Date | Status | Borrower | Loan Amount |
|---|---|---|---|
| Open | Powell Delkia J | $120,016 | |
| Previous Owner | Thomas William C | $113,600 | |
| Previous Owner | Womack Melvin E | $83,900 |
Source: Public Records
Tax History Compared to Growth
Tax History
| Year | Tax Paid | Tax Assessment Tax Assessment Total Assessment is a certain percentage of the fair market value that is determined by local assessors to be the total taxable value of land and additions on the property. | Land | Improvement |
|---|---|---|---|---|
| 2025 | $3,290 | $102,160 | $18,200 | $83,960 |
| 2024 | $3,343 | $98,240 | $18,200 | $80,040 |
| 2023 | $3,343 | $90,960 | $18,200 | $72,760 |
| 2022 | $2,623 | $78,640 | $11,120 | $67,520 |
| 2021 | $2,000 | $60,520 | $11,120 | $49,400 |
| 2020 | $1,750 | $53,120 | $11,120 | $42,000 |
| 2019 | $1,620 | $49,840 | $6,160 | $43,680 |
| 2018 | $1,180 | $45,800 | $6,160 | $39,640 |
| 2017 | $1,275 | $38,560 | $6,160 | $32,400 |
| 2016 | $984 | $31,000 | $6,160 | $24,840 |
| 2014 | $872 | $27,680 | $6,160 | $21,520 |
Source: Public Records
Map
Nearby Homes
- 731 Bridgewood Ct
- 672 Stonebridge Loop
- 728 Stonebridge Crescent
- 731 Stonebridge Park Cir
- 734 Stonebridge Park Cir
- 751 Stonebridge Park Cir
- 829 Carlingford Place
- 757 Stonebridge Park Cir
- 854 Asbury Trail
- 857 Asbury Trail
- 7536 Stonebridge Bay Ct
- 872 Asbury Trail
- 660 Kilkenny Cir
- 775 Edenberry Ln Unit 1
- 776 Edenberry Ln
- 616 Kilkenny Cir
- 596 Watson Cove
- 7249 Misty Harbor Ct
- 7427 Asbury Dr
- 791 Bristol Way Unit 1
- 798 Stonebridge Crescent
- 808 Stonebridge Crescent
- 794 Stonebridge Crescent
- 801 Stonebridge Crescent
- 801 Stonebridge Crescent Unit 192
- 812 Stonebridge Crescent
- 795 Stonebridge Crescent
- 811 Stonebridge Crescent
- 788 Stonebridge Crescent
- 787 Stonebridge Crescent
- 818 Stonebridge Crescent
- 817 Stonebridge Crescent
- 721 Bridge Way
- 782 Stonebridge Crescent
- 781 Stonebridge Crescent
- 722 Bridge Way
- 826 Stonebridge Crescent
- 719 Bridge Way
- 825 Stonebridge Crescent
- 776 Stonebridge Crescent